netjsongraph.js – Google Summer of Code (GSoC) 2017 summary

Throughout the last three months, I was quite fortunate to work for Freifunk on netjsongraph.js under the guidance of my mentor Federico Capoano. Thanks for this invaluable experience that I learned a lot of knowledge and use them in a practical project. Here is a summary of the work I have done during the Google Summer of Code (GSoC) 2017.

Google Summer of Code project page

Goal

netjsongraph.js is a visualization library for NetJSON, a network topology data format. The main goal of netjsongraph.js may be concluded in below three lines (more details you can see in GSoC 2017-netjsongraph.js: visualization of NetJSON data):

  • Apply the modern front-end development tools and add tests workflow (#1, #45)
  • Rewrite it with WebGL (#11, #29, #39, #42, #47)
  • Improve the performance (#41, #44, #46)

Achievement

Github Repository : https://github.com/netjson/netjsongraph.js

Examples on GitHub pages: https://netjson.github.io/netjsongraph.js/

You can browse all examples on GitHub pages. Some screen shots of the application:
basic example
performance example
The force-directed layout is usually used to visualize network data. It offers insights on the relationships between nodes and links. The previous version of netjsongraph.js is implemented by d3 and it’s rendered using SVG. It would be very slow if there were thousands or ten of thousands nodes or links. So I have to embrace the WebGL speeded up by GPU to have a better performance.

I have recorded my work in the blog every milestone:

BTW, It’s a great management method to make members submit weekly reports and blog posts in Freifunk.

During the three months, there have been 116 commits from me. I created a big Pull Request include them:
netjsongraph.js #48
netjsongraph.js project panels
Almost all goals have achieved:

  • Published a minor version
  • Improved development workflow
  • Tests Added
  • Refactored visualization by Three.js and d3-force
  • Added more interaction like hover (show nodes tooltips), click (show nodes or links information panel), pan and zoom
  • Improved performance

Especially on performance aspect, it runs efficiently on Chrome reached 60FPS under 5k nodes and 10k links. And if you don’t wanna animation, you can choose the static rendering layout.

Challenges

I also encounter some challenges I never met before.

Event binding and handling

As you know, WebGL renders all objects in one canvas tag. How to bind events on every geometry? You should use the Ray casting. Raycasting is used for mouse picking (working out what objects in the 3d space the mouse is over) amongst other things. So you can know which geometry your mouse over and add some interaction effect.
There are thousands of objects and every object has several events you should handle, I had to develop an event controller to manage it.

Performance

The bottleneck in this visualizer is performance(#41). I tried many methods to improve it include:

Reuse geometry and material

However, the color of every node is different and the one link should highlight itself when it hovered, so the material should be independent and can not use in common.

Combine the mesh

Same problem with above. It’s not flexible to combine them to one mesh, different nodes and links should have different positions.

Static rendering

Make calculation before rendering, so there is no animation and repaint.

Using Web Worker

Web Workers is a simple means for web content to run scripts in background threads. The worker thread can perform tasks without interfering with the user interface. So put static layout calculation into it will be efficient.

Force-directed algorithm

There are different complexity and cost in the different force-directed algorithm. The Force-Atlas2 algorithm has some benefits over the force layout implemented in d3-force. So current version may be refactored by an advanced algorithm in the future.

What is left to be done

  • Add optional geographic map (#40)
  • Using Force-Atlas2 algorithm

More interactions and features should be added, and performance may be optimized by using new algorithm. I’d like to continue developing this project after GSoC.

In the end, thanks for the great patience and guidance from my mentors. Thanks for Google to provide me with this rare chance to contribute to an open source community together with awesome members from all over the world. I really appreciate this invaluable experience accumulated this summer and I believe it will have the profound impact on my career and life.
GSoC: Improving nodewatcher data representation capability (update 3)

I have been working on improving the wlan-slo main page. This page has not been updated in a long time and it is crucial at introducing new people to mesh networking.

Continue reading “GSoC: Improving nodewatcher data representation capability (update 3)”

GSoC 2017-netjsongraph.js milestone 2

After a month of efforts, netjsongraph.js has been greatly improved.
First, I added some API and options are compatible with previous versions, except those that can not be added to the WebGL element. Followed by updating the documentation and some examples so that users can better understand and try out our projects. Finally, I have optimized interaction and performance.

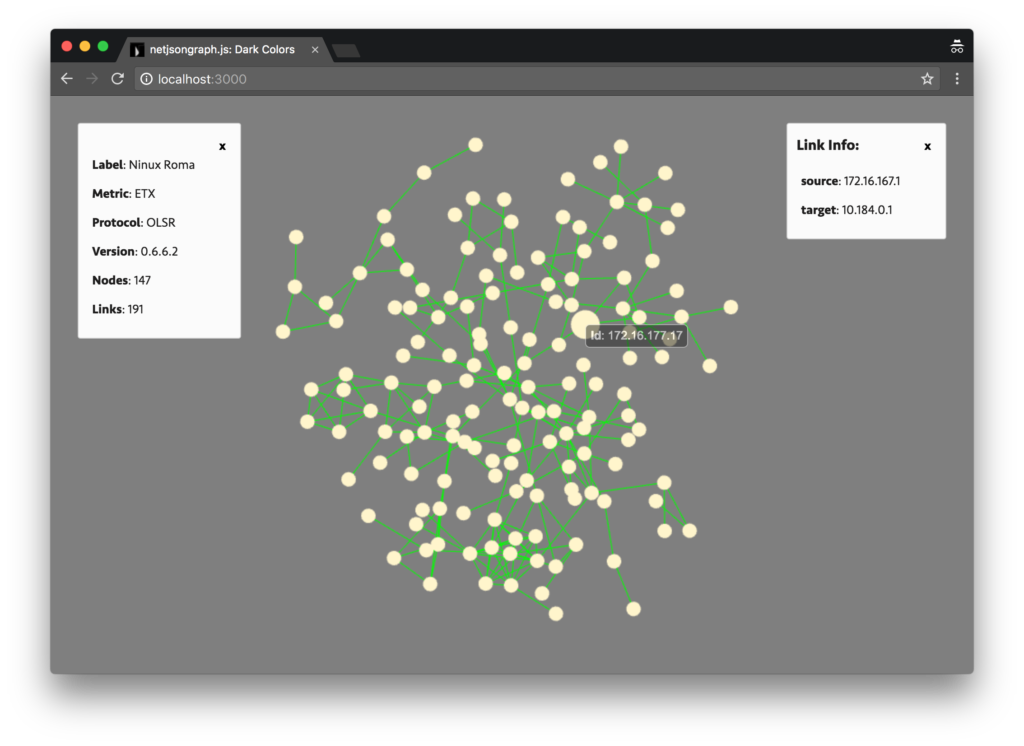
netjsongraph dark theme

Interaction

  • added highlight effect on nodes and links when hovered.
  • added tooltips with node information
  • added pan and zoom interaction
  • added node and link information panel when clicked
  • adjust the size of the canvas when the window resized

Performance

The large part of the performance of force-directed layout is consumed in each element position calculation in every tick. So if the position calculation of the elements is before canvas rendering, it is effective to reduce the performance loss.
So I made a static layout https://github.com/netjson/netjsongraph.js/issues/44, there is no animation when rendering, directly render a static force-directed layout in the page.

Other

Besides, I have refactored the event controller, in order to make zoom and pan or other events added easily.
But now the overall rendering results are not good as our expected. There is a little lag in animation, I currently have no idea about the reason, perhaps because this is not best practice of three.js. In the next stage, I will focus on solving performance problems and improving the visual effect.

Next Plan

The links below may be useful:

  • http://taligarsiel.com/Projects/howbrowserswork1.htm
  • http://igoro.com/archive/what-really-happens-when-you-navigate-to-a-url/
  • https://github.com/alex/what-happens-when
  • https://developer.mozilla.org/en-US/docs/Web/API/window/requestAnimationFrame

GSoC 2017 – Milestone 2

Following the rather stark change of direction after the last milestone (see my last post), I have worked on the integration of my project with Johannes Wegener’s: OpenWifi.

July Progress

For my software-defined networking (SDN) agent, I have added support for configuration through a UCI config file as well as process management through procd. This ties the daemon in neatly with the LEDE/OpenWRT system. Now, parameters such as the SDN controller’s address are read from this file and the configuration can be reloaded at runtime without stopping the agent.
Using the UCI system also exposes the configuration parameters to Johannes’ OpenWifi system. He and I discussed the bootstrapping process with our mentor and we have come up with the following idea: When a newly installed LEDE/OpenWRT access point first boots, it discovers the OpenWifi server via mDNS and fetches its configuration from it. With the address contained in the configuration, my SDN agent on the access point is able to connect to the SDN controller and thus integrate automatically with an existing centrally managed deployment. In the event of a configuration parameter change (e.g. a switch to a different SDN controller), OpenWifi can trigger a configuration reload to quickly update all access points in the network.

On the controller side, I have implemented a REST client to interface with OpenWifi. Through it, the controller can register with the OpenWifi server. During the registration, it installs its address and OpenFlow listening port in the UCI configuration which later gets sent to access points.
I have also begun writing a REST interface for my controller to offer more comfortable management of SDN applications and the network state. Right now, I can query the controller about its resources: access points, switches and clients. With the basics in place, expanding the interface to expose more SDN functionality should be pretty straightforward.

Next Steps

During the final part of this year’s GSoC, I want to focus on adding functionality, testing and documentation. I will spend the remaining weeks of the project like this:
1) write an SDN application
2) expose the app’s functionality via the controller’s command-line and REST interfaces
3) test it on the university department’s testbed
4) document its usage
5) goto 1)

Since the foundation for the SDN applications is in place and running, I am optimistic about getting a lot done during August. I will start with a client hearing map that keeps track of associated and unassociated clients in the vicinity of the deployment’s access points. Leveraging the hearing map, I want to implement a client load balancer that distributes associated clients evenly across available access points. I will also look into automated channel selection to avoid interference between neighbouring access points.
Finally, I would like to wrap up the controller in a docker image for easy deployment.

GSoC 2017-netjsongraph.js milestone 1

netjsongraph.js(GitHub) is a visualization library for NetJSON. During the first month, gratifying results have been achieved. I have done most tasks for the first stage of netjsongraph.json. Thanks for the nice mentor and this great chance to let me learn a lot of skill and techniques. Here are some results:

Minor version published

Npm is currently the largest open source package management community, it is very convenient for developers to release or iterative update netjsongraph.js.

Development workflow imporved

I have imported some modern front-end development tools to simplify the development process, including webpack (build tool), yarn (package management), babel, eslint, jest (test framework). Developer can run or test the project by one line command. all tools are advanced and familiar to JS developers, so they can contribute more easily.

Rewrited visualization by webGL

I had developed three demos with three different technologies: Sigma.js, Pixi.js and Three.js.
Sigma.js code looks very concise, but importing of its plugins (such as force layout plugin) in modern way is so hard. Pixi.js and Three.js I used it only to render d3 force layout. And three.js looks slow than Pixi.js but its slowness may caused by lines render way.
But I finally decide d3 4.0 and three.js is the best choice currently. Because they are both famous and iteration rapidly. Pixi.js is also great but it only support 2d render, so if we want to expand our visualisation to 3D in the future, we can only choose three.js. Three.js is a library which lightweight webGL packaging in order to avoid writing WebGL directly that is very hard and verbose.
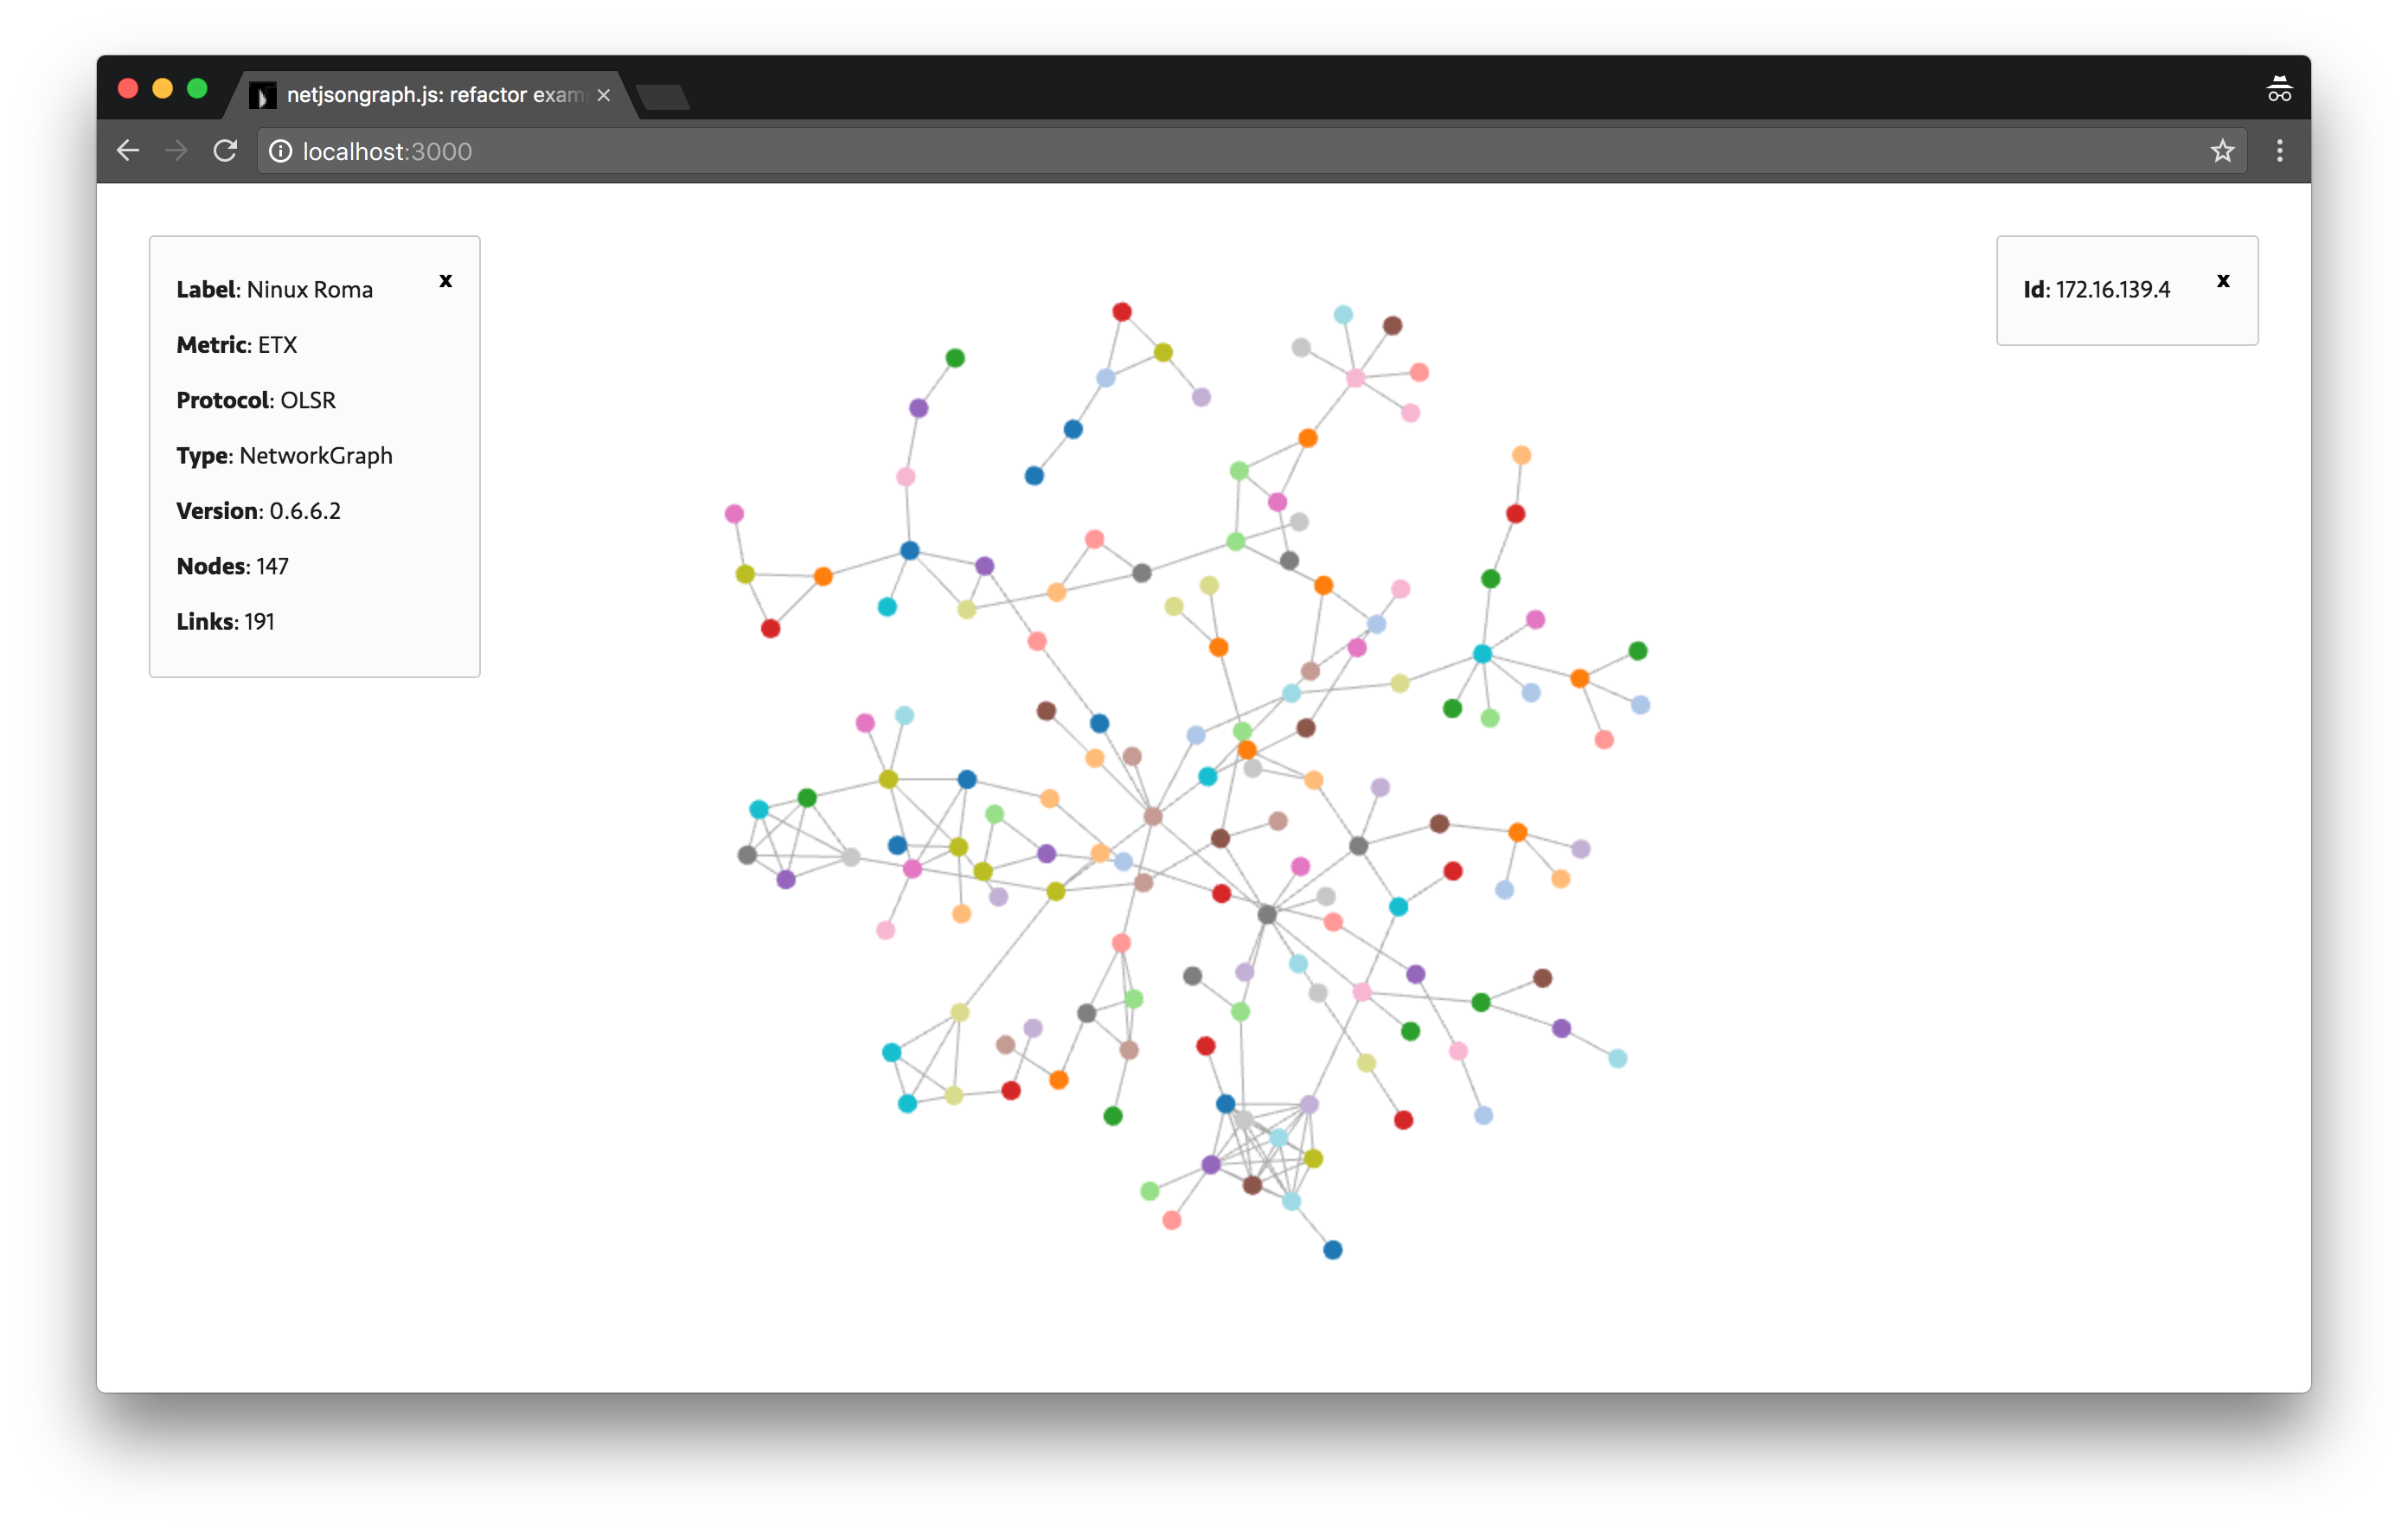
Then I refactored the demo to a Class and write some API backward compatible, including function to fetch data, theme switching, autosize, metadata and nodedata panel and zoom, hover, click event handler. It looks like:
netjsongraph.js
Metadata and node data panel are on top left and right corner, force graph for Netjson visualization in the center.

Tests added

Some unit tests have beed added and CI has beed integrated by Travis and Coverall. Because I wrote tests rarely before, so I meet some trouble and read a lot docs and examples to learn how to write test and how to use Jest. One problem I’ve met is test failed when import object with WebGL renderer. I’ve send a issue: https://github.com/facebook/jest/issues/3905 .

Next stage

I will complete the compatible API in the next week, and below are tasks for next milestone:

  • add optional geographic map
  • add a way to redraw graph by supplying new data
  • add more interactions
  • improve force layout details

Conclusion

Next version which have more interaction and rendered by WebGL is comming soon. and it will be soon integrated in the brand new OpenWISP 2 Network Topology module.

During this period I learned a lot of things, including how to use git rebase, how to write commit messages more clearly, how to write test, KISS principles, worse is better principles and so on. Great thanks for GSoC, Freifunk and mentor Federico.

GSoC 2017 – Milestone 1

June Progress

During the past weeks, I have mainly worked on LoxiGen. LoxiGen is a compiler which generates OpenFlow serialization and de-serialization libraries for C and Java. I have used the tool before and was able to build on my own work introducing the necessary message types for my GSoC project. Since I have chosen ONOS as my Software-Defined Networking (SDN) controller, I used ONOS’ fork of LoxiGen as a starting point. This required hard-coding some message types to make ONOS’ fork produce valid C libraries. I am planning to get in touch with LoxiGen’s maintainers soon to try and figure out if some of my work can be used towards a merge of the two diverted code bases.

[Edit: Major change of plan]

In an older version of this blog post, I wrote that I was going to implement a kernel module to enable the de-coupling of hostapd and the physical access point. Yesterday, I had a long discussion with my mentor and Johannes, another GSoC participant for Freifunk (read about his project here). We decided to drastically change the direction of my project. Instead of aiming for the (undoubtedly) cool and advanced feature of running hostapd as a Virtual Network Function, I am going to focus my efforts on a simpler use-case. The reasoning is to have a more stable and ready-to-use toolset for the management of larger OpenWRT/LEDE deployments in the end. In other words: Do less but do it well.

To this end, Johannes and I are going to work on a set of interfaces to make our projects compatible. The vision is as follows: I am going to write an SDN application that registers the ONOS controller with Johannes’ OpenWifi server. Whenever a new access point joins the network, it discovers the OpenWifi server and fetches its configuration from it. Included in this configuration are the address and port of the ONOS controller. Thus, the new network node is able to connect to the SDN controller without the need for manual configuration by the network operator.

Next Steps

As mentioned above, Johannes and I will have to establish interfaces for our projects to interact. We also need to set up a combined testbed to test our implementations. On my end, I will start by adding the possibility to configure the OpenWRT/LEDE agent that connects to the ONOS controller through UCI. That way, the agent’s configuration can be queried and altered through the OpenWifi REST API. This should be rather simple. Next, I will write a proper REST API for my controller as well as the application that communicates with the OpenWifi server. Then, I will add features for network management such as the ability to move clients to a specific access point or to ban them from connecting altogether. Lastly, I will write SDN applications for automatic network management, for example, a load balancer that distributes clients evenly across available access points that is powered by the data stored in a client hearing map.