netjsongraph.js(GitHub) is a visualization library for NetJSON. During the first month, gratifying results have been achieved. I have done most tasks for the first stage of netjsongraph.json. Thanks for the nice mentor and this great chance to let me learn a lot of skill and techniques. Here are some results:
Minor version published
Npm is currently the largest open source package management community, it is very convenient for developers to release or iterative update netjsongraph.js.
Development workflow imporved
I have imported some modern front-end development tools to simplify the development process, including webpack (build tool), yarn (package management), babel, eslint, jest (test framework). Developer can run or test the project by one line command. all tools are advanced and familiar to JS developers, so they can contribute more easily.
Rewrited visualization by webGL
I had developed three demos with three different technologies: Sigma.js, Pixi.js and Three.js.
Sigma.js code looks very concise, but importing of its plugins (such as force layout plugin) in modern way is so hard. Pixi.js and Three.js I used it only to render d3 force layout. And three.js looks slow than Pixi.js but its slowness may caused by lines render way.
But I finally decide d3 4.0 and three.js is the best choice currently. Because they are both famous and iteration rapidly. Pixi.js is also great but it only support 2d render, so if we want to expand our visualisation to 3D in the future, we can only choose three.js. Three.js is a library which lightweight webGL packaging in order to avoid writing WebGL directly that is very hard and verbose.
Then I refactored the demo to a Class and write some API backward compatible, including function to fetch data, theme switching, autosize, metadata and nodedata panel and zoom, hover, click event handler. It looks like:
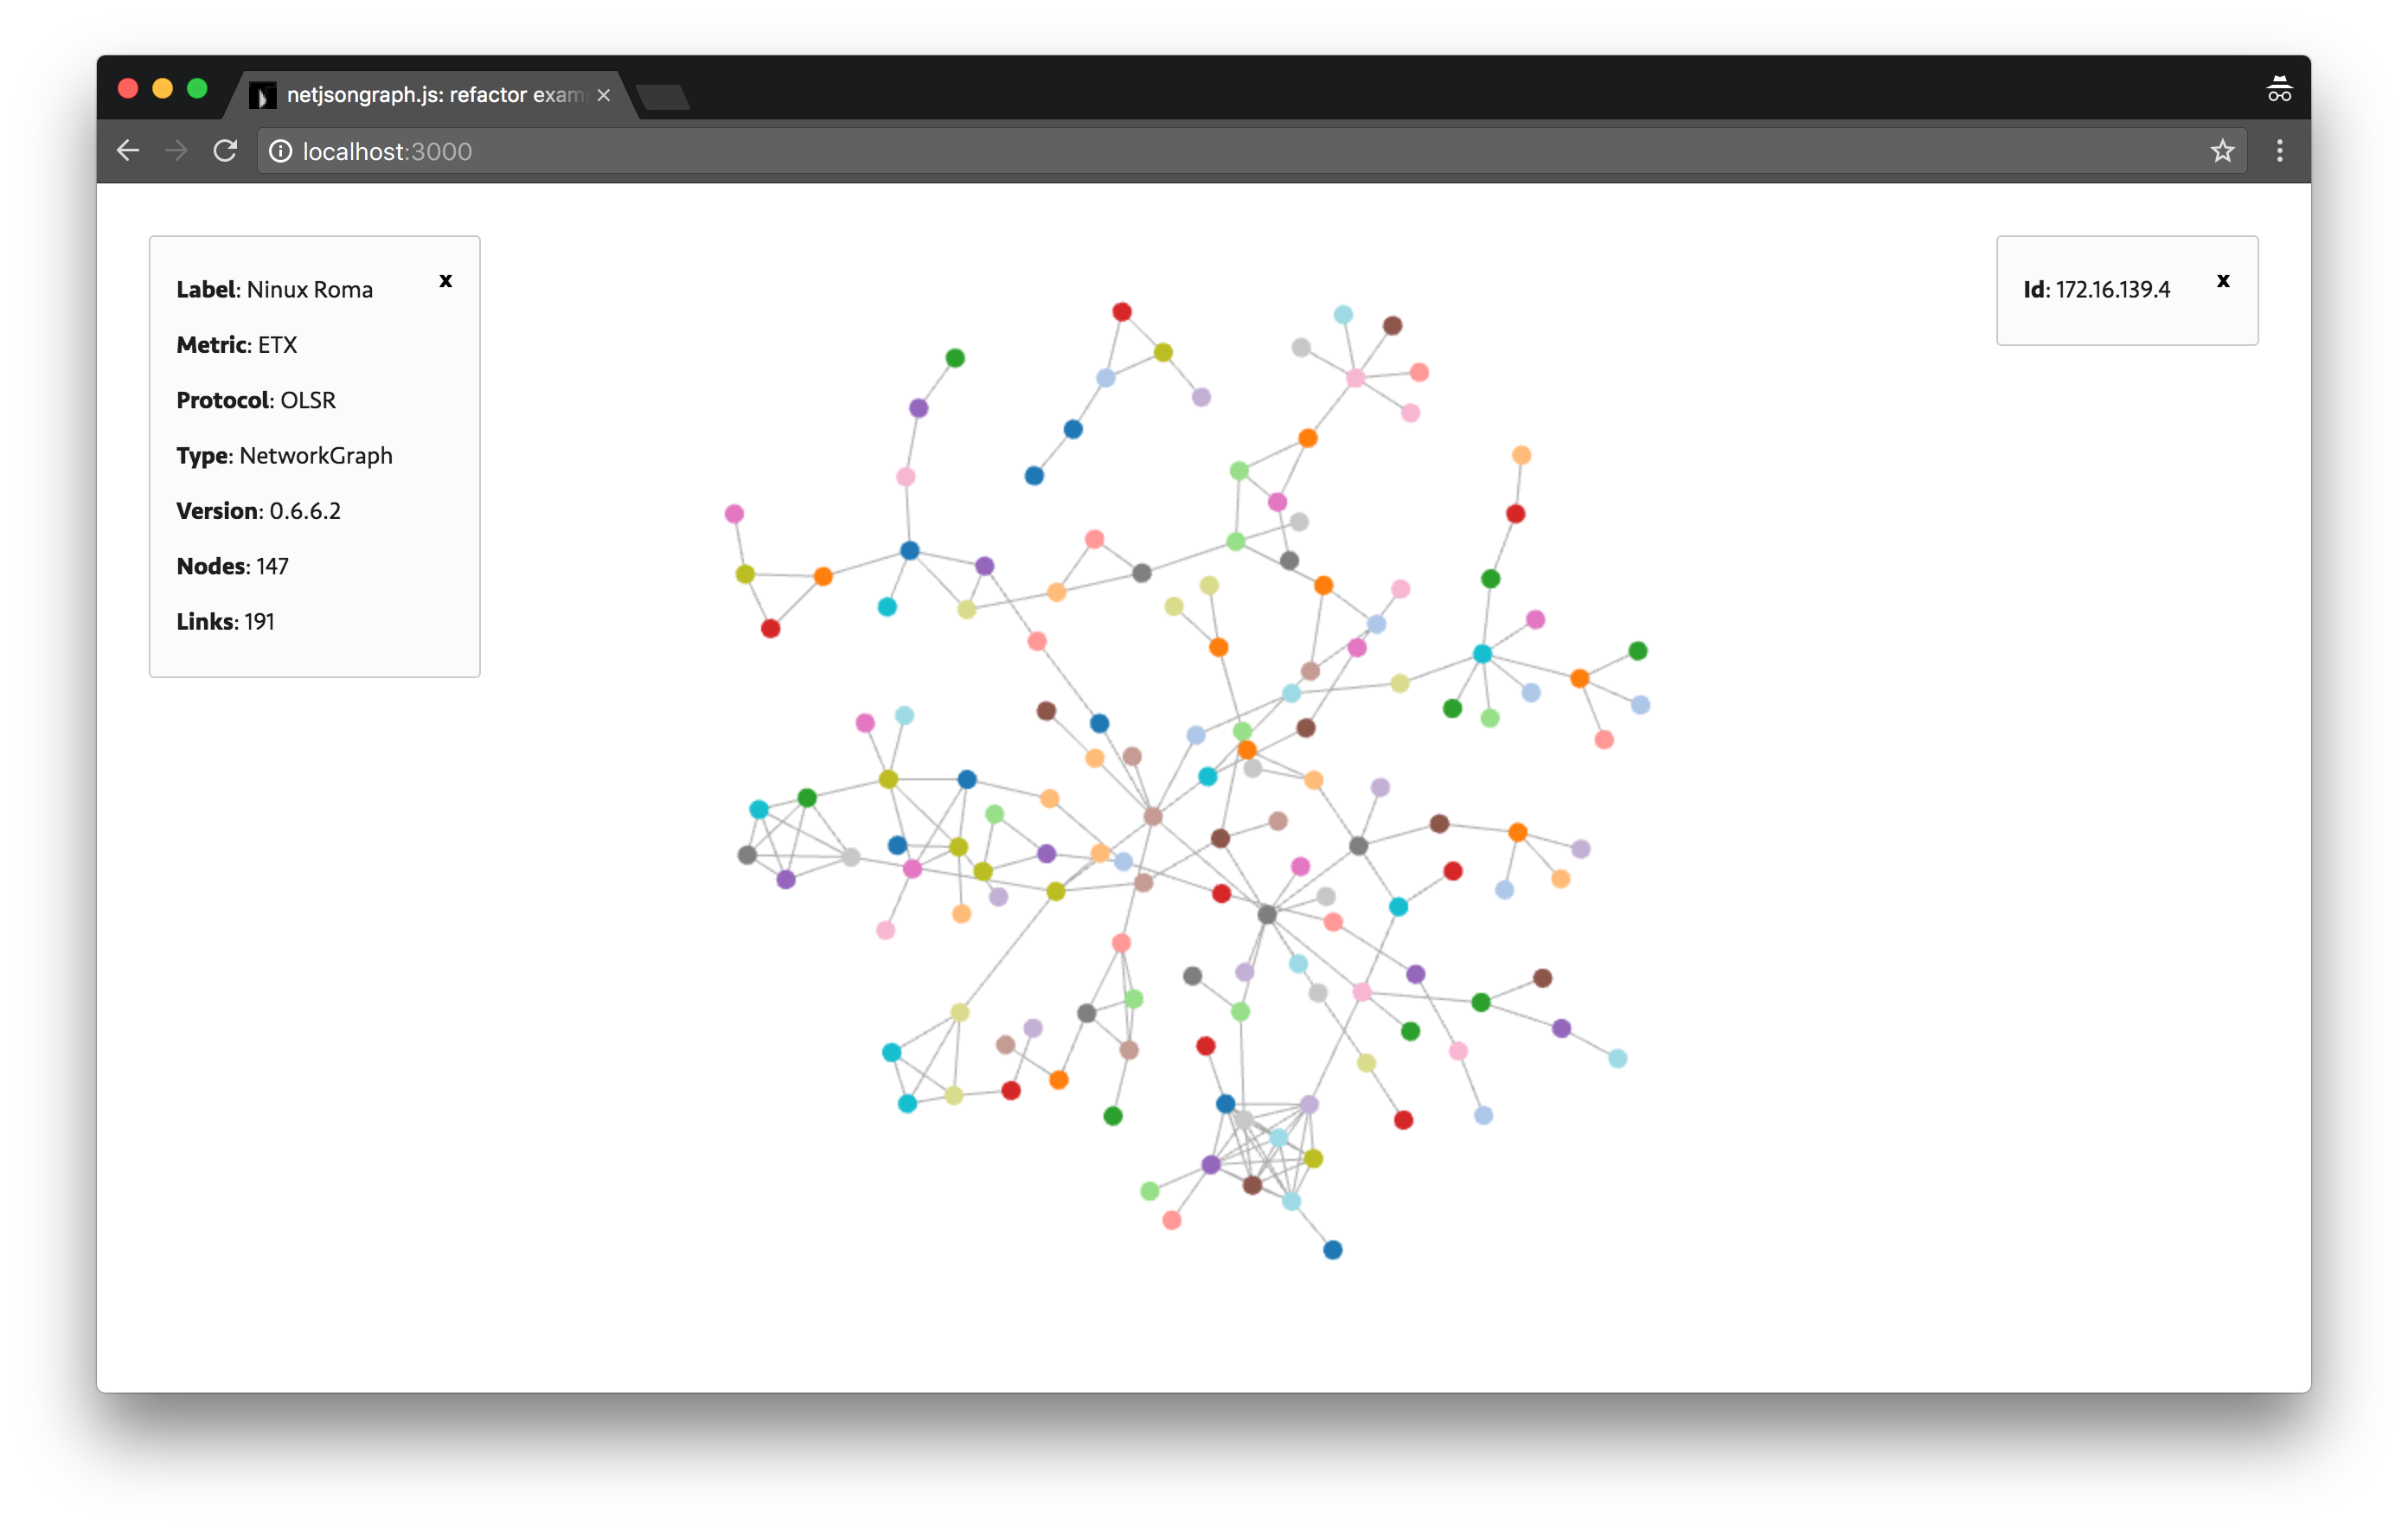
Metadata and node data panel are on top left and right corner, force graph for Netjson visualization in the center.
Tests added
Some unit tests have beed added and CI has beed integrated by Travis and Coverall. Because I wrote tests rarely before, so I meet some trouble and read a lot docs and examples to learn how to write test and how to use Jest. One problem I’ve met is test failed when import object with WebGL renderer. I’ve send a issue: https://github.com/facebook/jest/issues/3905 .
Next stage
I will complete the compatible API in the next week, and below are tasks for next milestone:
- add optional geographic map
- add a way to redraw graph by supplying new data
- add more interactions
- improve force layout details
Conclusion
Next version which have more interaction and rendered by WebGL is comming soon. and it will be soon integrated in the brand new OpenWISP 2 Network Topology module.
During this period I learned a lot of things, including how to use git rebase, how to write commit messages more clearly, how to write test, KISS principles, worse is better principles and so on. Great thanks for GSoC, Freifunk and mentor Federico.