netjsongraph.js – Google Summer of Code (GSoC) 2017 summary

Throughout the last three months, I was quite fortunate to work for Freifunk on netjsongraph.js under the guidance of my mentor Federico Capoano. Thanks for this invaluable experience that I learned a lot of knowledge and use them in a practical project. Here is a summary of the work I have done during the Google Summer of Code (GSoC) 2017.

Google Summer of Code project page

Goal

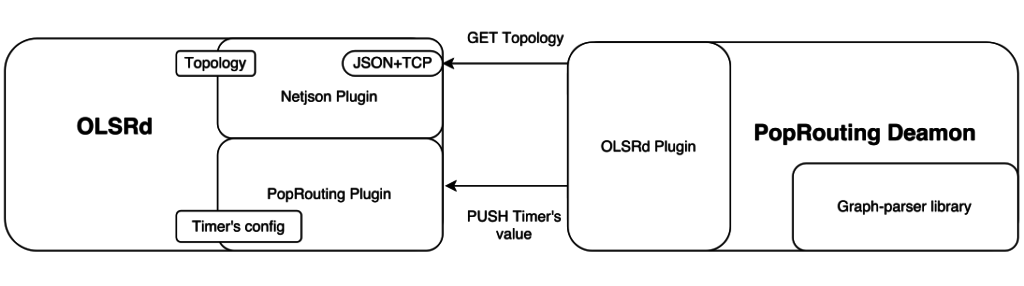
netjsongraph.js is a visualization library for NetJSON, a network topology data format. The main goal of netjsongraph.js may be concluded in below three lines (more details you can see in GSoC 2017-netjsongraph.js: visualization of NetJSON data):

  • Apply the modern front-end development tools and add tests workflow (#1, #45)
  • Rewrite it with WebGL (#11, #29, #39, #42, #47)
  • Improve the performance (#41, #44, #46)

Achievement

Github Repository : https://github.com/netjson/netjsongraph.js

Examples on GitHub pages: https://netjson.github.io/netjsongraph.js/

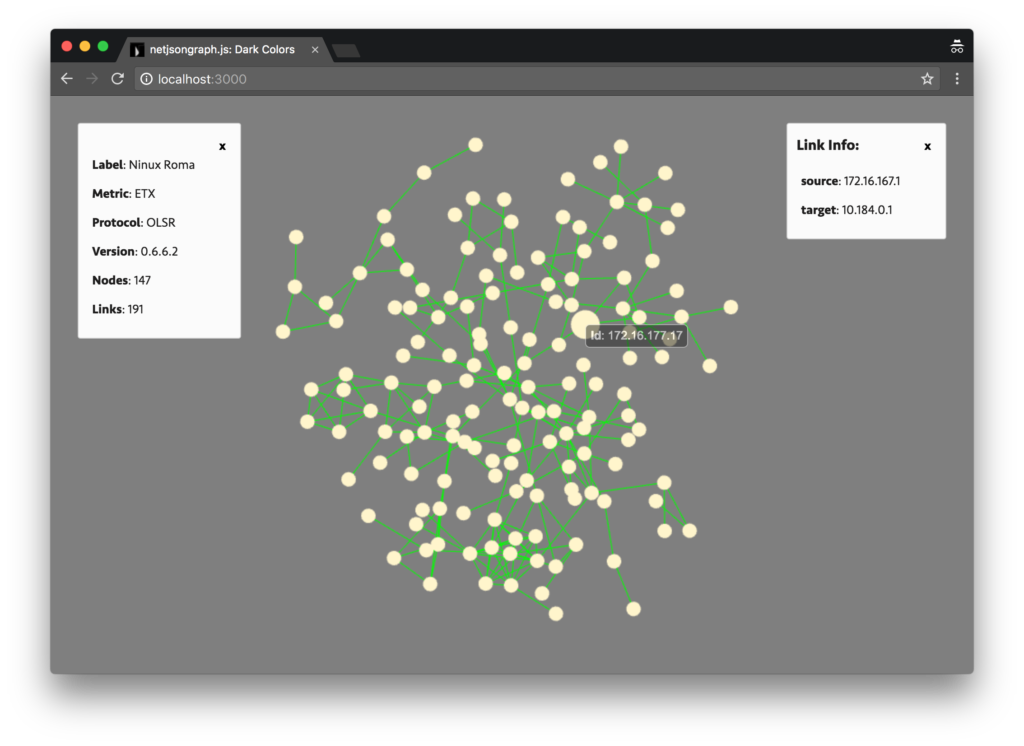
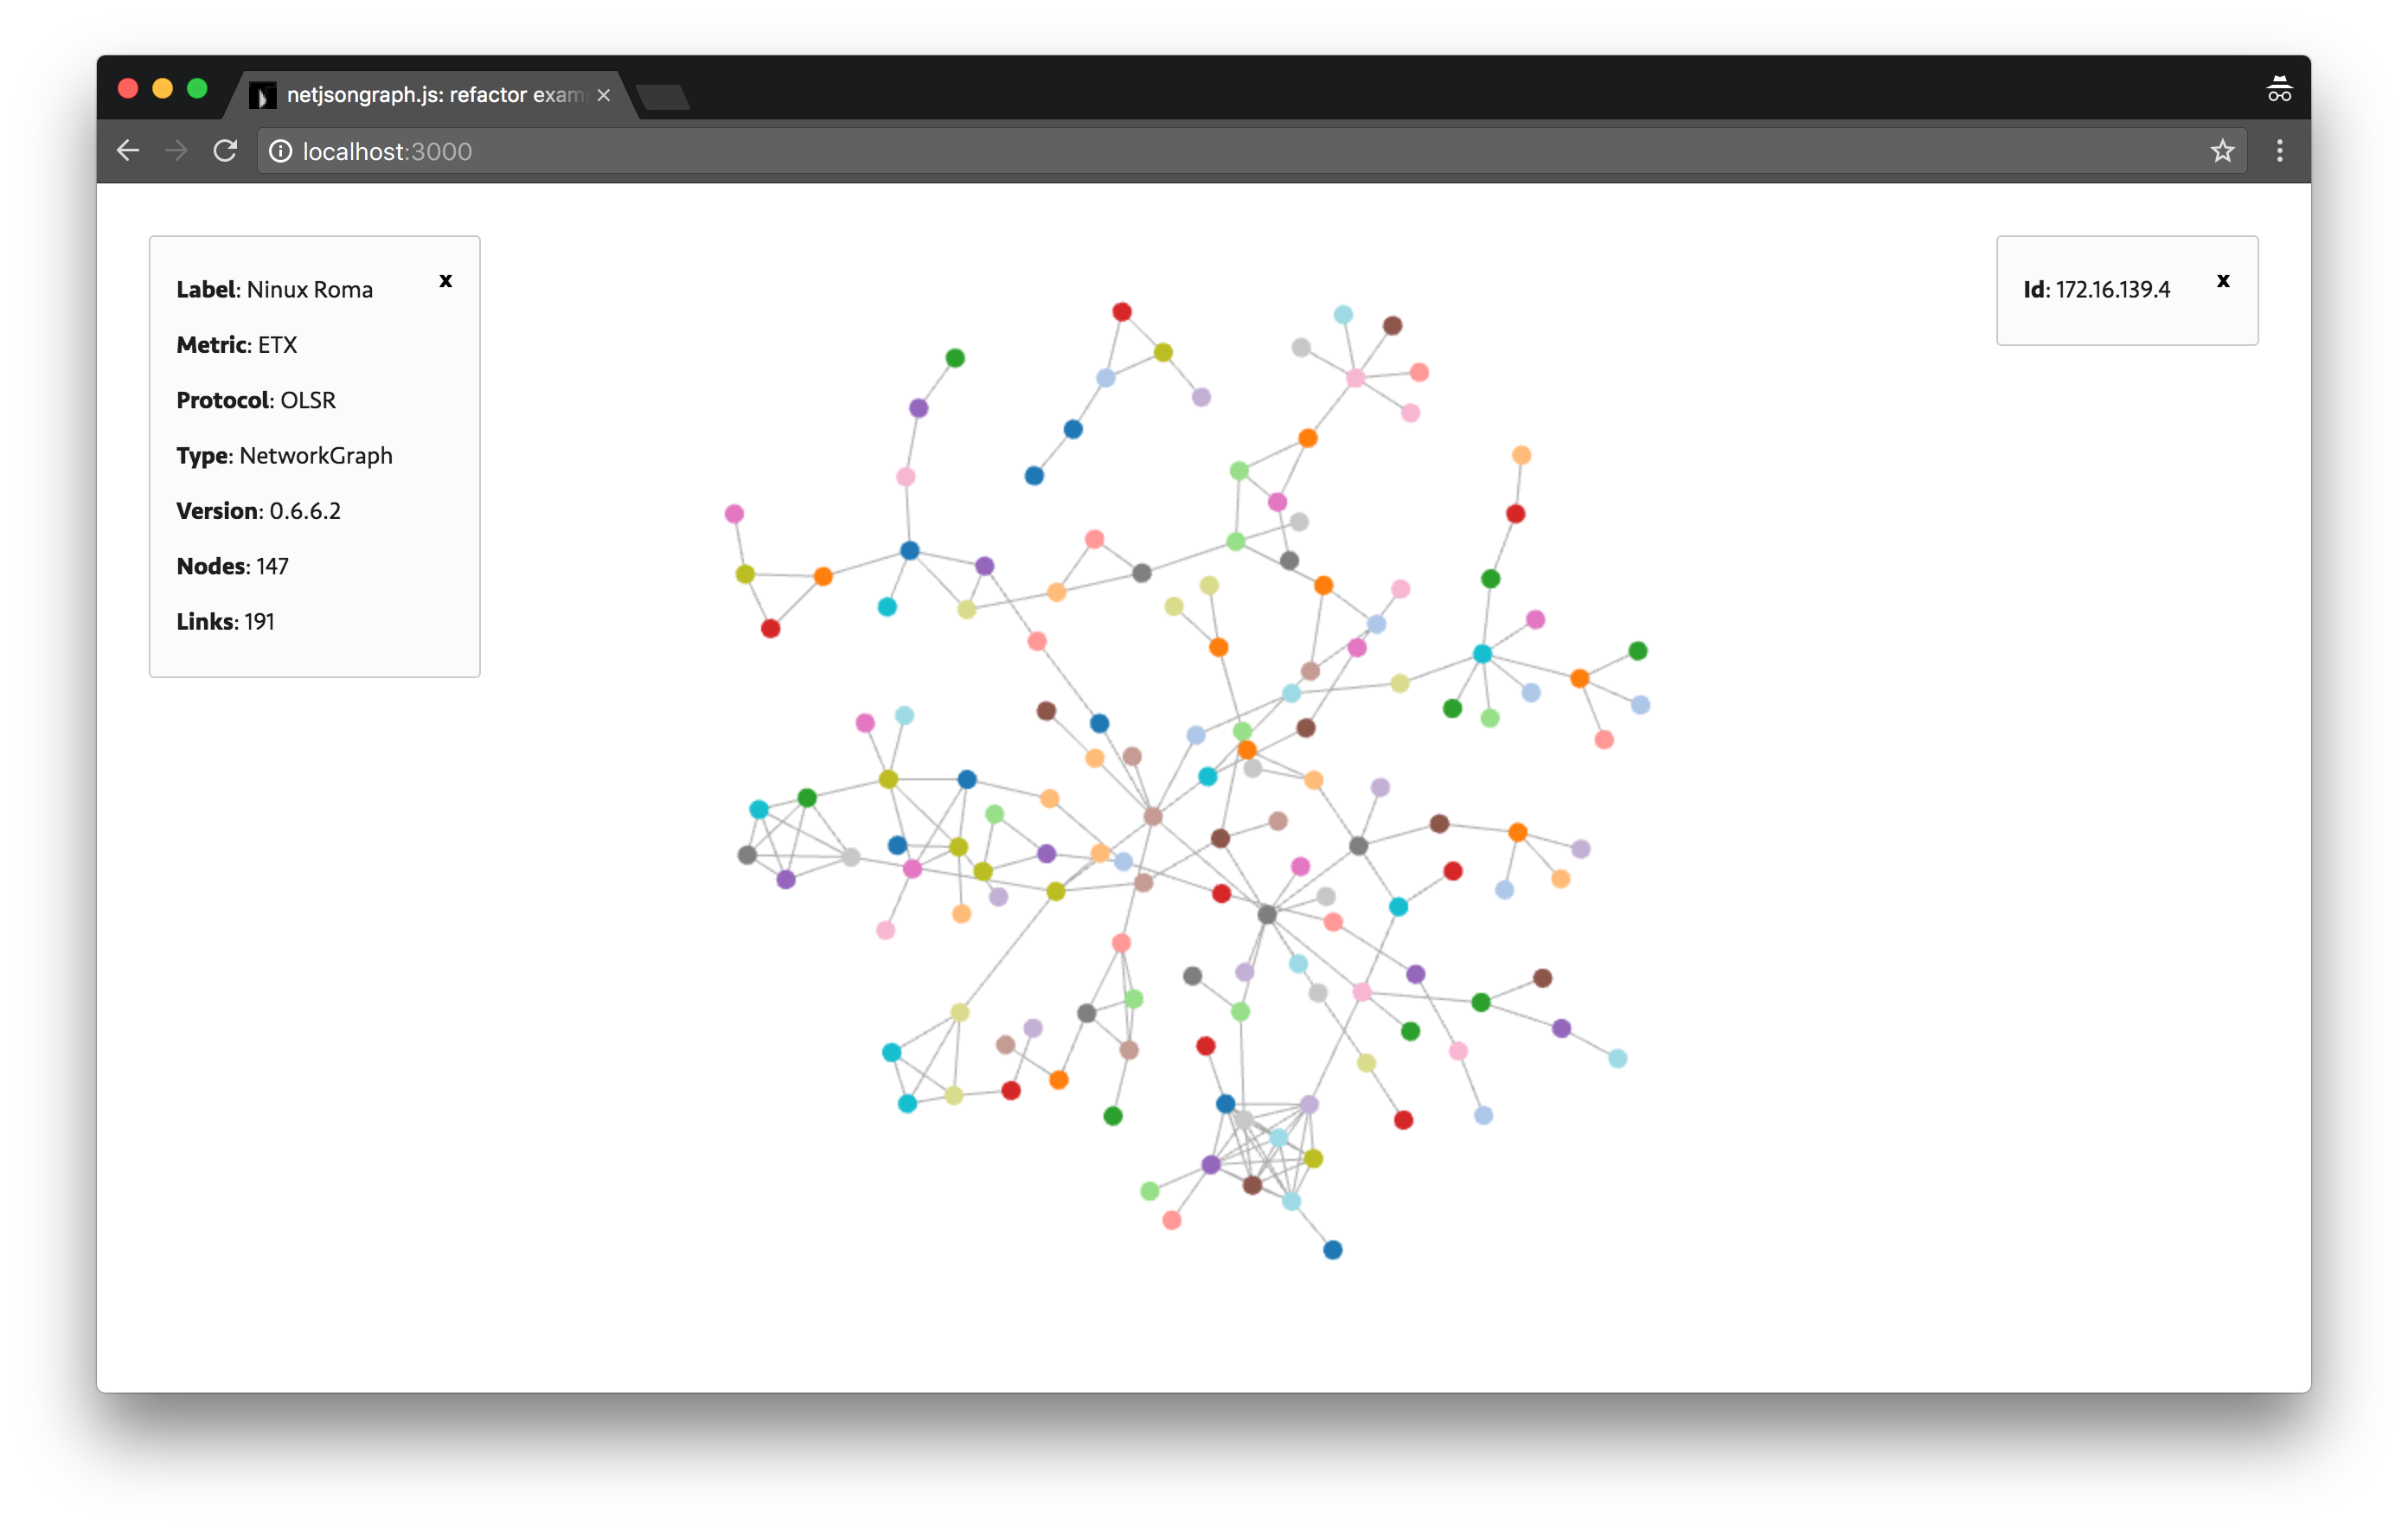
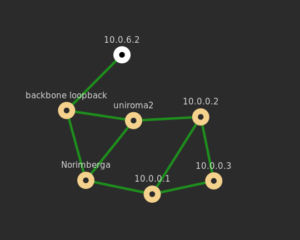
You can browse all examples on GitHub pages. Some screen shots of the application:
basic example
performance example
The force-directed layout is usually used to visualize network data. It offers insights on the relationships between nodes and links. The previous version of netjsongraph.js is implemented by d3 and it’s rendered using SVG. It would be very slow if there were thousands or ten of thousands nodes or links. So I have to embrace the WebGL speeded up by GPU to have a better performance.

I have recorded my work in the blog every milestone:

BTW, It’s a great management method to make members submit weekly reports and blog posts in Freifunk.

During the three months, there have been 116 commits from me. I created a big Pull Request include them:
netjsongraph.js #48
netjsongraph.js project panels
Almost all goals have achieved:

  • Published a minor version
  • Improved development workflow
  • Tests Added
  • Refactored visualization by Three.js and d3-force
  • Added more interaction like hover (show nodes tooltips), click (show nodes or links information panel), pan and zoom
  • Improved performance

Especially on performance aspect, it runs efficiently on Chrome reached 60FPS under 5k nodes and 10k links. And if you don’t wanna animation, you can choose the static rendering layout.

Challenges

I also encounter some challenges I never met before.

Event binding and handling

As you know, WebGL renders all objects in one canvas tag. How to bind events on every geometry? You should use the Ray casting. Raycasting is used for mouse picking (working out what objects in the 3d space the mouse is over) amongst other things. So you can know which geometry your mouse over and add some interaction effect.
There are thousands of objects and every object has several events you should handle, I had to develop an event controller to manage it.

Performance

The bottleneck in this visualizer is performance(#41). I tried many methods to improve it include:

Reuse geometry and material

However, the color of every node is different and the one link should highlight itself when it hovered, so the material should be independent and can not use in common.

Combine the mesh

Same problem with above. It’s not flexible to combine them to one mesh, different nodes and links should have different positions.

Static rendering

Make calculation before rendering, so there is no animation and repaint.

Using Web Worker

Web Workers is a simple means for web content to run scripts in background threads. The worker thread can perform tasks without interfering with the user interface. So put static layout calculation into it will be efficient.

Force-directed algorithm

There are different complexity and cost in the different force-directed algorithm. The Force-Atlas2 algorithm has some benefits over the force layout implemented in d3-force. So current version may be refactored by an advanced algorithm in the future.

What is left to be done

  • Add optional geographic map (#40)
  • Using Force-Atlas2 algorithm

More interactions and features should be added, and performance may be optimized by using new algorithm. I’d like to continue developing this project after GSoC.

In the end, thanks for the great patience and guidance from my mentors. Thanks for Google to provide me with this rare chance to contribute to an open source community together with awesome members from all over the world. I really appreciate this invaluable experience accumulated this summer and I believe it will have the profound impact on my career and life.

Implementing Pop-Routing in OSPF – July Updates

In the last months some issues emerged with the original plan of my project.
After implementing topology export in NetJSON format for BIRD, I started investigating how to modify the timers of OSPF, and finally found that OSPF has a limitation regarding the timers, which states that all the routers on the same network must have the same timers. This is surprising, since the RFC supports specifying the timer in the messages, and thus it would be trivial to have nodes with differentiated timers (as OLSR and other protocols do, for instance). Actually somewhere else in the RFC it is stated that even if the timers could be diversified, they must be used as a network-wide parameter, otherwise routers wont pair as neighbor. This issue is not easy to solve, and would break the compatibility with other OSPF implementations, thus, together with my mentor we decided to change the project on something that we could accomplish in the remaining time and that was still helpful for Wireless Communities.

Since many WCNs in Europe are still using OLSRv1 we’ve decided to implement PopRouting on it. The NetJSON plugin[1] is already available so we only had to implement the Timer’s plugin and the PRINCE plugin to communicate with it.

During this mont I’ve implemented and alpha version of the Pop-Routing plugin[2] for OLSRd. This plugin is quite simple, it listens to a specified port and it parse two commands : “/HelloTimer=xx.yy” and “/TcTimer=xx.yy”, where xx.yy are floating point numbers.

I’ve also implemented the Prince plugin[3] that communicate with OLSRd. It fetches the topology from the NetJSON plugin and it pushes the updated timers to the PopRouting Plugin.

The next month I am going to fix all the bugs I found, document the plugins and test Pop-Routing with NEPA test.

Despite those problems the implementation of NetJSON for OSPF is working and we hope it will be merged in the BIRD codebase soon.

Cheers, Gabriel

[1]: https://github.com/OLSR/olsrd/tree/master/lib/netjson
[2]: https://github.com/AdvancedNetworkingSystems/olsrd/tree/poprouting/lib/poprouting
[3]: https://github.com/AdvancedNetworkingSystems/poprouting/blob/refactor_ospf/prince/src/olsr/olsr.c

GSoC 2017-netjsongraph.js milestone 2

After a month of efforts, netjsongraph.js has been greatly improved.
First, I added some API and options are compatible with previous versions, except those that can not be added to the WebGL element. Followed by updating the documentation and some examples so that users can better understand and try out our projects. Finally, I have optimized interaction and performance.

netjsongraph dark theme

Interaction

  • added highlight effect on nodes and links when hovered.
  • added tooltips with node information
  • added pan and zoom interaction
  • added node and link information panel when clicked
  • adjust the size of the canvas when the window resized

Performance

The large part of the performance of force-directed layout is consumed in each element position calculation in every tick. So if the position calculation of the elements is before canvas rendering, it is effective to reduce the performance loss.
So I made a static layout https://github.com/netjson/netjsongraph.js/issues/44, there is no animation when rendering, directly render a static force-directed layout in the page.

Other

Besides, I have refactored the event controller, in order to make zoom and pan or other events added easily.
But now the overall rendering results are not good as our expected. There is a little lag in animation, I currently have no idea about the reason, perhaps because this is not best practice of three.js. In the next stage, I will focus on solving performance problems and improving the visual effect.

Next Plan

The links below may be useful:

  • http://taligarsiel.com/Projects/howbrowserswork1.htm
  • http://igoro.com/archive/what-really-happens-when-you-navigate-to-a-url/
  • https://github.com/alex/what-happens-when
  • https://developer.mozilla.org/en-US/docs/Web/API/window/requestAnimationFrame

GSoC 2017-netjsongraph.js milestone 1

netjsongraph.js(GitHub) is a visualization library for NetJSON. During the first month, gratifying results have been achieved. I have done most tasks for the first stage of netjsongraph.json. Thanks for the nice mentor and this great chance to let me learn a lot of skill and techniques. Here are some results:

Minor version published

Npm is currently the largest open source package management community, it is very convenient for developers to release or iterative update netjsongraph.js.

Development workflow imporved

I have imported some modern front-end development tools to simplify the development process, including webpack (build tool), yarn (package management), babel, eslint, jest (test framework). Developer can run or test the project by one line command. all tools are advanced and familiar to JS developers, so they can contribute more easily.

Rewrited visualization by webGL

I had developed three demos with three different technologies: Sigma.js, Pixi.js and Three.js.
Sigma.js code looks very concise, but importing of its plugins (such as force layout plugin) in modern way is so hard. Pixi.js and Three.js I used it only to render d3 force layout. And three.js looks slow than Pixi.js but its slowness may caused by lines render way.
But I finally decide d3 4.0 and three.js is the best choice currently. Because they are both famous and iteration rapidly. Pixi.js is also great but it only support 2d render, so if we want to expand our visualisation to 3D in the future, we can only choose three.js. Three.js is a library which lightweight webGL packaging in order to avoid writing WebGL directly that is very hard and verbose.
Then I refactored the demo to a Class and write some API backward compatible, including function to fetch data, theme switching, autosize, metadata and nodedata panel and zoom, hover, click event handler. It looks like:
netjsongraph.js
Metadata and node data panel are on top left and right corner, force graph for Netjson visualization in the center.

Tests added

Some unit tests have beed added and CI has beed integrated by Travis and Coverall. Because I wrote tests rarely before, so I meet some trouble and read a lot docs and examples to learn how to write test and how to use Jest. One problem I’ve met is test failed when import object with WebGL renderer. I’ve send a issue: https://github.com/facebook/jest/issues/3905 .

Next stage

I will complete the compatible API in the next week, and below are tasks for next milestone:

  • add optional geographic map
  • add a way to redraw graph by supplying new data
  • add more interactions
  • improve force layout details

Conclusion

Next version which have more interaction and rendered by WebGL is comming soon. and it will be soon integrated in the brand new OpenWISP 2 Network Topology module.

During this period I learned a lot of things, including how to use git rebase, how to write commit messages more clearly, how to write test, KISS principles, worse is better principles and so on. Great thanks for GSoC, Freifunk and mentor Federico.

Implementing Pop-Routing in OSPF – June Updates

This is a continuation of the previous post [1].

During this month I have implemented the NetJSON plugin for BIRD. It exposes the topology of an OSPF Area using the network-graph format and thus allows Prince to fetch the topology and calculate the timer’s value.
I deployed a small testbed to debug my code using the network emulator called CORE [2]
Here you can see the testbed:

I’m currently working on this repository [3] and I’m looking forward to send a PR to BIRD.
I defined a new command in the bird’s cli: “show ospf topology netjson”. It returns a network-graph output that can be used by prince or by any other NetJSON[4] compatible software.
Here you can see the topology of the testbed using d3.js [5][6].

In this next coding period I will implement a plugin for Prince that interacts with BIRD. Unfortunately it uses a UNIX Domain socket instead of a network socket, so I’ll need to code the communication routines from scratch.

Cheers, Gabriel

[1]: https://blog.freifunk.net/2017/05/30/implementing-pop-routing-ospf
[2]: https://www.nrl.navy.mil/itd/ncs/products/core
[3]: https://github.com/AdvancedNetworkingSystems/bird/tree/origin/int-new
[4]: http://netjson.org
[5]: http://ninux-graph.netjson.org/topology/49aecbcf-a639-47a7-9f58-e39de5d57161/
[6]: https://github.com/netjson/django-netjsongraph

GSoC 2017-netjsongraph.js: visualization of NetJSON data

Project intro

NetJSON is a data format based on JSON(What is NetJSON?), and netjsongraph.js(GitHub) is a visualization library for it. This library has attracted quite some interest from around the world, but there are some defects, such as tests and modern build process lacking.

Therefore our goal is to improve the features and development workflow of netjsongraph.js. To be specific:

  • make it faster with large numbers
  • make it more mobile friendly
  • use modern tools that are familiar to JS developers, so they can contribute more easily
  • add automated tests so we can be more confident of introducing changes
  • get rid of complex features
  • make it easy to extend, so users can experiment and build their own derivatives
  • make it easy to redraw/update the graph as new data comes in, at least at the library level we should support this
  • geographic visualization (like https://ninux.nodeshot.org/ (nodeshot project)

Arrangement

About me

I’m a graduate student from China and also a front-end developer with more than one-year working experience. And now I am interested in the Data Visualization and already made several visualization projects of network structure. So lucky my proposal selected by Freifunk in Google Summer of Code 2017. It’s a great opportunity to participate in a promising open source project. Thanks for my mentor’s guidance and hope I can finish an excellent job. So I listed the following plan:

Tasks and Schedule

  • create a new branch: build the project with yarn, Webpack and Babel. 1 week
  • To build a (mostly) backward compatible version 1 week
  • draw a demo graph using canvas or WebGL. 2 week
  • make a example page to show visualization results. 1 week
  • add test(using Ava and XO) and CI. 1 week
  • discuss and design visualization view 1 week
  • import and integrate with OpenStreeMap or Mapbox to make a map. 1 week
  • visualization implemention. 8 weeks
  • beautify the visualization. 1 weeks
  • improve visualization and test. 4 weeks
  • design interface for plugin (to make this library extensible) *2 week