ConTest update #3

During this coding phase I added OpenWrt Makefiles to package conTest and the attenuator control software.
In addition some documentation was added, but most of the time I spend chasing the down the errors mentioned in the last blog post.

Figure 1
Figure 2

This error seems to be, that a certain attenuation gets repeated, while the config says something different.
After some long error hunting sessions RegMon[link] was added to the testbed to retrieve more information on the connection and hopefully
the error itself. RegMon allows to monitor the time consumption of ath9k wireless cards In there the error does not show up. While in
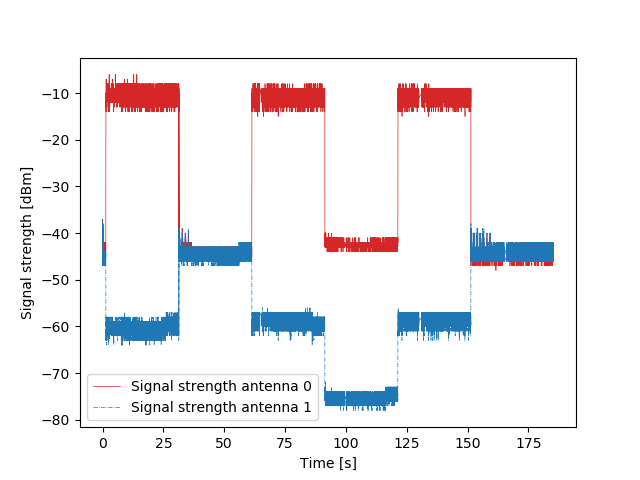
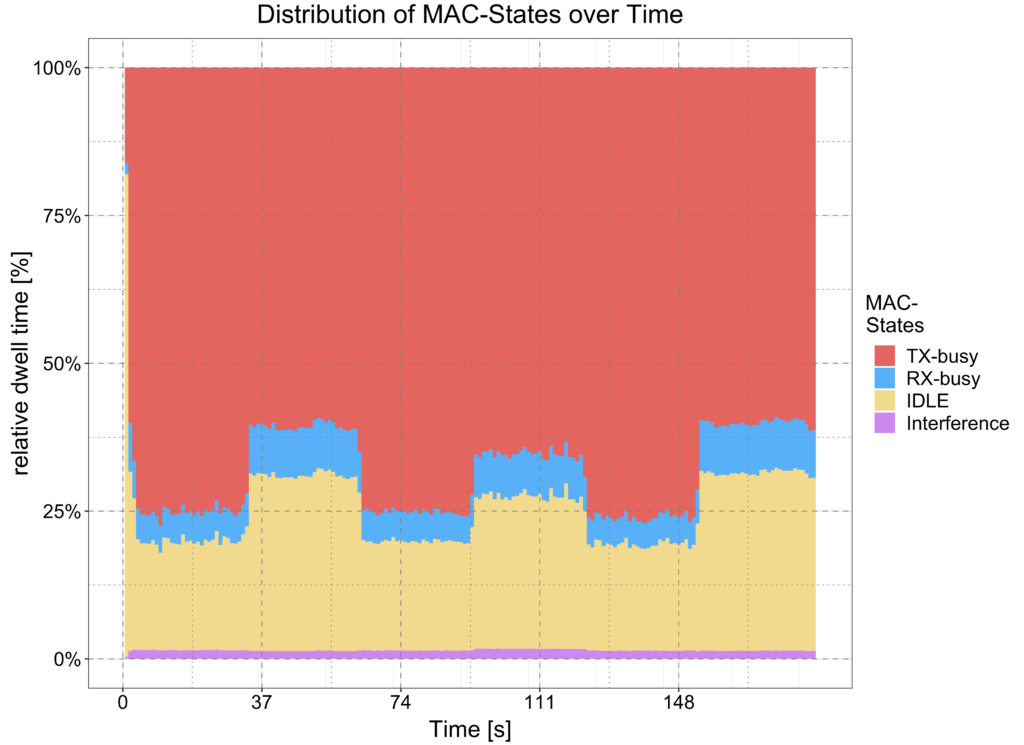
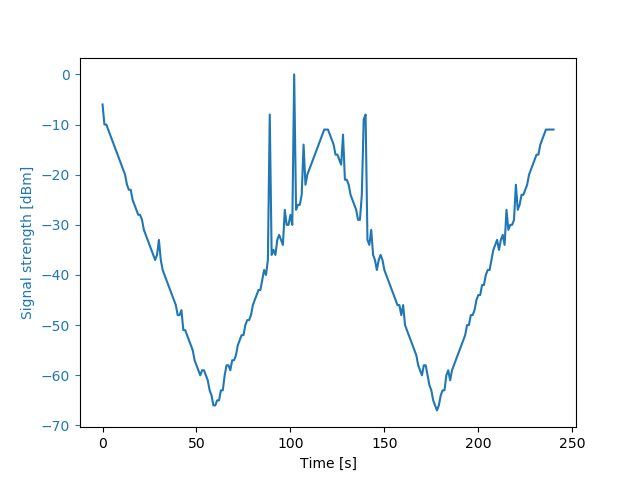
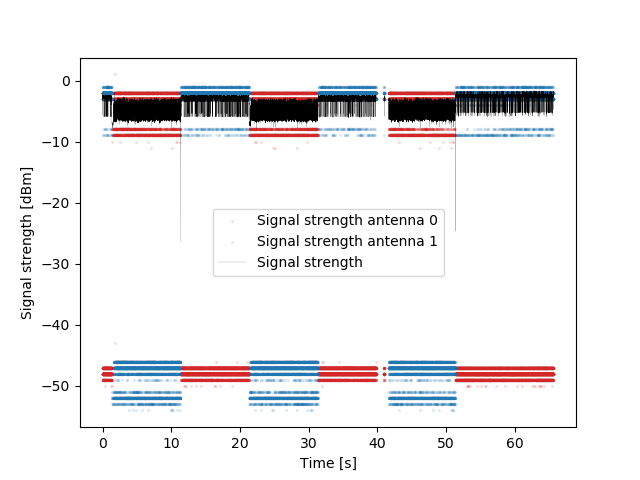
figure 1 the attenuation for signal 1 seems to be repeated, the RegMon diagramm (fig 2) does not show this behaviour. In figure 2 you can see
the time a wireless card spends sending (red) or receiving (blue) data, idling (yellowish) or taking care of interference (pink).
If the connection is dampened the needed time for sending/receiving data increases, as a more robust MCS, spatial stream and guard interval
combination is selected. Based on figure 1 I would expect the cards to have a higher busy time portion than shown in figure 2 at the problematic section.

Unfortunately an update broke the functionality of the regmon evaluation scripts, so I started to port it from R to Python3 to use it in future debugging sessions.
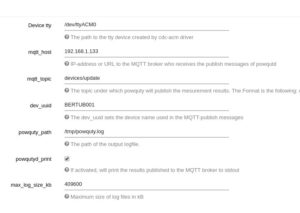
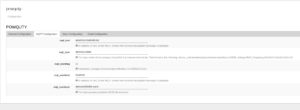
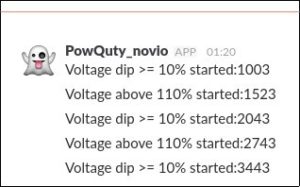
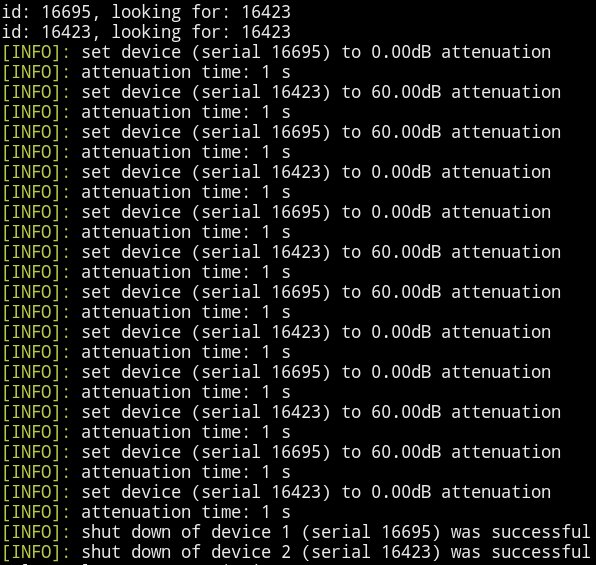
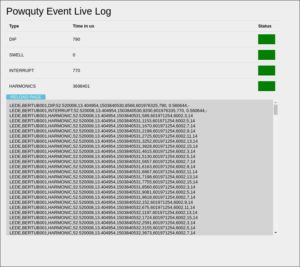
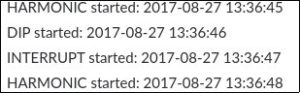
Figure 3 shows console output from the control program. The shown attention values are acquired from the digital attenuator shortly after the value was set
by the software. These values are as expected and show the correct behavior. The difference between the attenuation values on signal 0 and signal 1
originate from an added analogous attenuator.

Figure 3

Interestingly, after several tests with linear increasing/decreasing attenuation, the behaviour on figure 1 could not be observed.

I started to dig into the driver software of the Vaunix Labbrick attenuator, but did not find problematic code so far. But the first next step should be,
that the RegMon evaluation script is usable again. After that I will continue to look into the driver of the digital attenuator and in the worst case dive
into tcpdump, to see how it acquires the signal strength values.

conTest – Wireless Testing Framework Second Update

During this coding period I added automatic processing of the data
collected by the wireless testing framework conTest, as well as the graphical
representation of the data.

While processing the data I found some issues in the controller software
as well as the physical testbed.

Most of the tests since the last Blog post were done with the attenuation values
you can see in in the lists below. I changed timing values between the experiments,
to validate the behavior.

Attenuator 1 uses the following values for its attenuation settings:

  • 10 s -> 0 dB
  • 10 s -> 60 dB
  • 10 s -> 0 dB
  • 10 s -> 60 dB

Attenuator 2:

  • 10 s -> 60 dB
  • 10 s -> 0 dB
  • 10 s -> 60 dB
  • 10 s -> 0 dB

My initial experiment to test functionality was not the best one to validate the
testbed (fig. 2). As both paths were basically set to the same attenuation
I only checked the signal in Wireshark as seen in figure 2, which matches mostly with
the black line in the closer look in figure 3.
The second figure was created with my evaluation scripts, while the first one was
created with wireshark during the first tests.

Figure 2: Signal strength as shown with wireshark from original testing
Figure 3: Separated signal strength curves of the original values with evaluation scripts

In the testbed I am using two analogous attenuator in addition to the programmable
attenuator. Figure 4 shows, that one path is stronger dampened. Without the
analogous blocks both paths are nearly equally attenuated, which could mean,
that one of them is broken, or not meant for the frequency range, while both of them
should be. It will need some further investigation, but as I had most of my exams
during this coding phase, I was a little short on time. For now I will continue
without these two devices.

Figure 4: Signal strength difference caused by problems with the analogous attenuator

In figure 4 you can see a section where the one of
the two paths is not following the values presented in the lists at the beginning of this post.

This is a problem in the control software of the digital attenuator. I was able to work around
it and fix two more problems in the software. The actual problem needs more time
researching putting into it, but more than I could afford at this time.

Figure 5: Signal strength curves without analogous attenuator and solved software problem

The evaluation script will check for our default files, filter out data, we want
to plot, like signal strength, selected MCS rate, throughout rate and packet
numbers. Afterwards the plots are constructed with python and matplotlib.

For most figures, places with more intense red and blue colour are values, which
were encountered more often. The black line represents the overall signal strength
provided by tcpdump.

conTest – First Update for GSoC 2019

During the last few weeks I setup the testbed for the wireless connection testing
framework conTest and brought in some new functions
The figure below show the physical setup, followed by a schematic overview.

conTest testbed setup
Schematic overview of conTest setup

The user can now specify which files should be collected by conTest.
Currently there is only an overall collection time adjustable by the user. To
ensure everything is captured, half the time interval the most frequently written
file uses should be set. As a next step I will introduce individual file read times,
as this will reduce network, CPU and storage/memory load.

In addition I added functions to monitor the wireless network interfaces and
capture the traffic using tcpdump. The captured output will be written to the
controlling machine directly over the wired network interface.

I started to improve the overall code quality of conTest to have a solid code base.
To reduce overhead I started sharing code between the monitoring part, which can
be separated from the rest of the conTest framework.

The current reduced flow of conTest can be seen in the figure below. conTest will
check if the necessary dependencies are present, after it processed the command line
arguments and loaded the configuration file. If all dependencies are present, conTest
will start it’s first test run. Before each test run, it will check if there are
packages provided by the user to update and install them. After that the program
will check if the user provided the monitoring flag and start tcpdump accordingly.
Now conTest will start iperf on both sides after killing all running iperf processes.
I’m the next step the parallelized file collection and the attenuator control software
is started. After the attenuator controller returns the software collection
is stopped and the program restarts the loop until the given number of experiments is
finished.

ConTest reduced flowchart

Unfortunately there isn’t anything flashy to show right now. The next steps will
be to create a Makefile and package both applications. Furthermore I will add some
scripts to process the collected data and scripts working on it for data representation.
In addition I will add sane defaults to the config file and add individual file
collection speed.

conTest – A wireless testbed

Hi,my name is Stefan and I am a second time GSoC student. I participated in 2017 for Freifunk and
helped to improve the power quality monitoring tool PowQuty. I am currently doing my master in
“Information and communication technologies” This time I want provide a testing framework for wireless
resource allocation algorithms like Minstrel and Minstrel-Blues. It’s called conTest.

The Idea

ConTest aims to provide a reliable environment to create and evaluate repeatable test with wireless
equipment. It integrates the control software fur digital attenuators from Vaunix. To compare changes in
algorithm it is important to recreate the same test environment for the second experiment you run the
first experiment in. Only if both experiments are run under similar conditions, results are reliable.
ConTest will allow the automated collection auf files like rc_stats and ani log files.

The Setup

Therefore I will setup an example testbed composed of two APU boards equipped with ath9k a/n cards and
running OpenWrt. The SMA connectors of the routers are connected with an attenuator over coaxial cables.
The attenuators are currently controlled by a raspberry pi. In addition the Pi also collects and stores
all the files.
The use of one bus on the pi for Ethernet and USB could prove as bottleneck, when data is written to an
USB device and frequent changes have to be send to the attenuators. One of the APU boards will act as an
access point and provide a WLAN the other access point connects to as a client.

For traffic generation I want to use iperf3 and monitor the resulting traffic on both routers on a monitor
interface with tcpdump. Some files (like rc_stats for Minstrel) provide relevant information about the
algorithm. I want to collect the relevant files, but keep the decision which files to collect and the
frequency of the collection in the hand of the user.Therefore conTest should be configured from a config
file. A schematic of the testbed can be seen below.

The Results

To make the software as usable as possible I will provide an OpenWrt package for the Vaunix controll
software and the test framework. To ease the testing of changes or new algorithms, conTest will
feature options for automated data preprocessing and representation of the collected data.

If you have additional ideas, would should definetly be in conTest or more questions feel free to
comment or contact me.


Best regards
Stefan

PowQuty Live Log GSoC 2017 Final Update

This is the last blog entry in the series of Google Summer of Code project updates. It will describe, what has been done and what is left to improve in the future in the PowQuty project.

Powquty

PowQuty is a power quality monitoring tool, which can be installed on a router running LEDE or OpenWrt. The router can be connected to an USB oscilloscope providing measurements which powqutyd will process and provide to the user in human readable form.
All this was tested on a x86 based LEDE router.

GSoC 2017

During this Google Summer of Code a live log functionality was added to PowQuty to provide information on power quality events. These events are:

  • voltage dip of 10% – 90% of the reference voltage on the measurement signal
  • voltage swell > 110% of the reference voltage on the measurement signal
  • voltage dip < 10% of the reference voltage on the measurement signal
  • > 5% of the measured values of one specific harmonic are over the defined threshold
  • On event occurrence important information like time, duration and event type will be written to a log file and presented in the extended luci app.

    As shown in the above picture, the interface provides a traffic light like color system behind these events, green indicates everything is within the EN50160 power quality norm. Yellow means, that 80% of the maximum time per week is already reached, red means, that the norm was violated during the last week.
    In addition to log writes, notifications are send out with Mosquitto. Mosquitto is a message broker using the MQTT protocol. It provides a publish/subscribe model, which allows a central server to subscribe to a topic and clients to send out messages to the server with a topic. Mosquitto was already in use in powquty but was extended for EN50160 event notifications. This will allow a central logging of bigger power supply networks, monitored by multiple devices.

    As another option Slack messages can be send by powquty now. Slack is a messaging program, using (as one option among many) webhooks for interaction. Everyone with the webhook can send messages to the team. Sending out messages allows a user to react quickly to changing situations, or get immediately informed on power event occurrence.

    Beginning with pull request 20 [https://github.com/thuehn/PowQuty/pull/20] I started to implement these features.
    First an option was developed to read measurements from a file, as most power supply networks are pretty stable and wont provide many opportunities to test event handling in powquty.
    Afterwards slack and MQTT notifications where added.
    During testing of mosquitto event messages, some seemed to be lost on intervals with many En50160 events in a short period(sometimes more than 35 events per seconds). The solution seems to buffer all events before sending.
    Something similar happened with Slack. Slack only allows one message per second(short bursts excluded) [rate-limits].
    Buffering events would resolve this problem as well. An option for live email notification was considered at first, but was dropped as spam protection would stop most of the messages and probably list users as spammers.
    The last step was to add the traffic light system to the luci app, to enable users without knowledge of the norm to get an idea of the power quality of their power supply network.
    In addition a slack library was written [libwebslack] to send slack messages from PowQuty.

    What can be improved
  • As mentioned before event buffering is needed and will be added after GSoC
  • Email notification in form of a weekly summary
  • More Error checking and handling
  • improving libwebslack to not use libcurl to reduce its size
  • provide libwebslack as OpenWrt/LEDE package, for easier future use
  • Finally I have to thank Dr. Thomas Huehn for being my mentor and Freifunk for their work they do and especially for being a mentoring organisation for Google Summer of Code.
    Last but not least I would like to thank Google for making this all possible.

    If you want to review some of my earlier posts:

  • Introduction
  • First Update
  • Second Update
  • Best regards
    Stefan

    PowQuty Live Log Second Update

    It’s been nearly a month since my last update on the PowQuty Live Log project and i would like to tell you, what has been done
    so far and provide information on what will be done in the next month.

    PowQuty got updated, to support Slack and mqtt event notification and can already be used in the current PowQuty version.
    In addition to this, there have been some bug fixes during the last month and some new features were added.
    On event occurrence the event gets stored in a csv file and each entry is displayed in the luci-app. To increase the usability,
    a traffic light system will be added, which will show for each event type its occurrence time and show if the current values
    are in violation of EN50160.

  • Green: Everything is ok, no violation
  • Yellow: Close to a violation
  • Red: This event time is in violation of the norm
  • The event messages contain a times stamp, the duration of the event and updated event Type information, as well as event type related
    information and GPS data.
    .

    As receiving notifications or emails on every event occasion can get noisy, we decided to provide a weekly summary of the events in
    addition to the regular notifications.
    The user will be able to decide if he wants to receive this summary, every event, or both. We consider using the traffic light system
    here as well, to increase the readability and enable users to understand the quality of their power supply network, without a lot of
    knowledge of the EN50160 norm.
    We discussed individual intervals and keep it in mind as a possible later feature.

    Best regards
    Stefan

    PowQuty Live Log First Update

    As mentioned in my previous blog post, i am going to add a live log and notification system for
    certain events to the power monitoring tool PowQuty. The first steps have been done and the
    configuration has been extended.
    Three types of notifications have been added to the configuration options during the first month of coding.
    Namely email, slack and mqtt. Mqtt was in use before, but was extended to allow a second host and topic for
    the power quality events.
    The powquty configuration page was redesigned to use a separate tab for each notification option
    to increase overview.

    The old configuration page would have been very crowded with all the new options
    The new configuration view with mqtt tab open

    Power quality events, that cause a notification are:

    • Voltage dip between 10% and 90% of the reference voltage of 230V
    • Voltage swell above 110% of the reference voltage of 230V
    • Voltage dip < 10% of the reference voltage
    • More than 5% of the samples of one harmonic are above the threshold

    As the power supply network in Berlin was not willing to provide such events an option for test measurement
    input was needed. A file read flag for powqutyd was added and needs a little bit of clean up
    before a pull request on the upstream powqutyd.
    The library for the USB-oscilloscope provides the number of EN50160 events per measure cycle and
    the kind of each event. As of now some basic slack notifications are added, which provide the event
    type and the event start time from measurement start in milliseconds to the channel and team set
    in the luci web interface or under /etc/conf/powquty.

    Slack notifications with start time in milliseconds relative to measurement start, probably will be UTC or local in the future

    In the notification the type of event is provided to allow the network administrator to react directly
    to the changes, without to check the log any further.
    The other notification options will be added and tested soon.

    PowQuty Live Log introduction

    Hi everyone,

    I’m Stefan and happy to present my GSoC 2017 project to you.
    That is extending the PowQuty daemon and luci web-app with an event log and notification system for events violating the EN-50160 norm.
    Probably most of you don’t know powquty. Therefore i will give a short introduction to it, before I present my actual project.
     

    PowQuty

    PowQuty[1] is an application for measuring power quality parameters of the power grid like voltage and frequency. It receives samples by a USB connected oscilloscope and writes the calculated values to a log file. This log can be read by the powquty luci web-app. The web interface will plot the measurements directly into several graphs. These are power over time, frequency over time and metrics over time.
    It was implemented during the last GSoC by Neez El Sayed [2] and its intention is “to strengthen the role of open software in the uprising smart grids by providing some essential functionalities”.
     

    PowQuty Live-log

    The goal of this project is to provide an event log of measurements that are outside defined parameters.
    Public power distribution networks have to meet certain criteria. These are formulated in the EN50160 norm.
    If there is a power drop, or a frequency spike PowQuty will write this to its log like every other value. The user can examine the log file or its graphical representation for critical values, but essential equipment could already be damaged.
    If such an event occurred, a user or power network administrator should be notified. This event log will get a graphical interpretation in the luci powquty app as well to enable a better tracking of events.
    This will allow users of PowQuty to react quickly to changing conditions in power supply networks.

    Therefore we will add a notification system to PowQuty as well as additional logging options.
    To collect events at a central server we will extend the mqtt usage to send an mqtt notification on a violating event.
    In addition we will add an email and slack notification option to allow quick responses.


    [1]: https://github.com/thuehn/PowQuty
    [2]: https://blog.freifunk.net/author/Neez-El-Sayed/