During this coding period I added automatic processing of the data
collected by the wireless testing framework conTest, as well as the graphical
representation of the data.
While processing the data I found some issues in the controller software
as well as the physical testbed.
Most of the tests since the last Blog post were done with the attenuation values
you can see in in the lists below. I changed timing values between the experiments,
to validate the behavior.
Attenuator 1 uses the following values for its attenuation settings:
- 10 s -> 0 dB
- 10 s -> 60 dB
- 10 s -> 0 dB
- 10 s -> 60 dB
- …
Attenuator 2:
- 10 s -> 60 dB
- 10 s -> 0 dB
- 10 s -> 60 dB
- 10 s -> 0 dB
- …
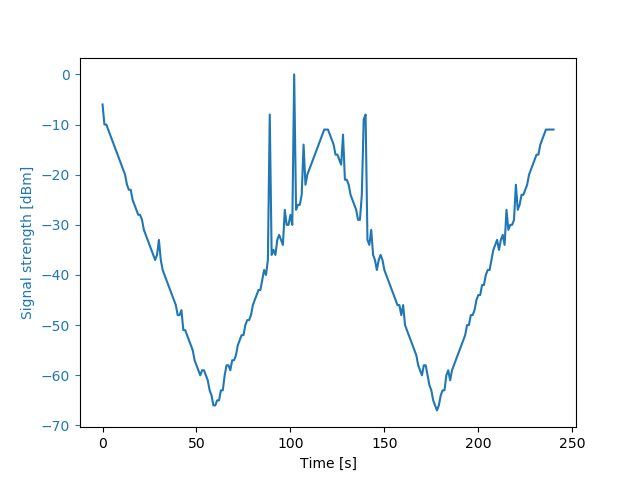
My initial experiment to test functionality was not the best one to validate the
testbed (fig. 2). As both paths were basically set to the same attenuation
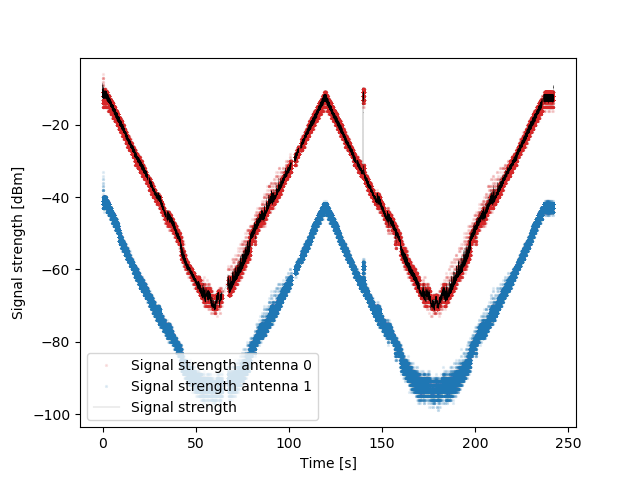
I only checked the signal in Wireshark as seen in figure 2, which matches mostly with
the black line in the closer look in figure 3.
The second figure was created with my evaluation scripts, while the first one was
created with wireshark during the first tests.
In the testbed I am using two analogous attenuator in addition to the programmable
attenuator. Figure 4 shows, that one path is stronger dampened. Without the
analogous blocks both paths are nearly equally attenuated, which could mean,
that one of them is broken, or not meant for the frequency range, while both of them
should be. It will need some further investigation, but as I had most of my exams
during this coding phase, I was a little short on time. For now I will continue
without these two devices.
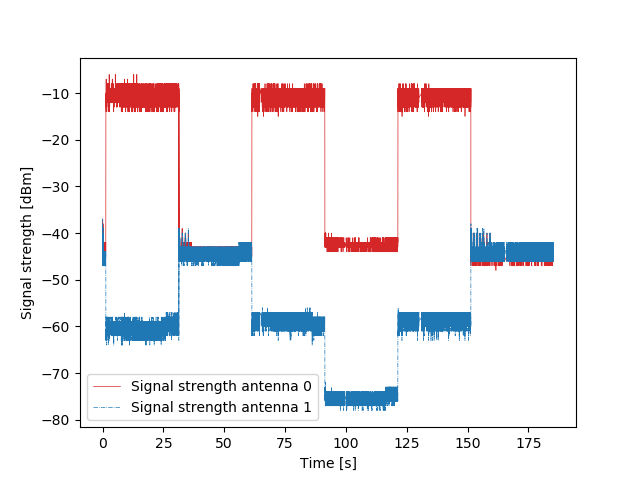
In figure 4 you can see a section where the one of
the two paths is not following the values presented in the lists at the beginning of this post.
This is a problem in the control software of the digital attenuator. I was able to work around
it and fix two more problems in the software. The actual problem needs more time
researching putting into it, but more than I could afford at this time.
The evaluation script will check for our default files, filter out data, we want
to plot, like signal strength, selected MCS rate, throughout rate and packet
numbers. Afterwards the plots are constructed with python and matplotlib.
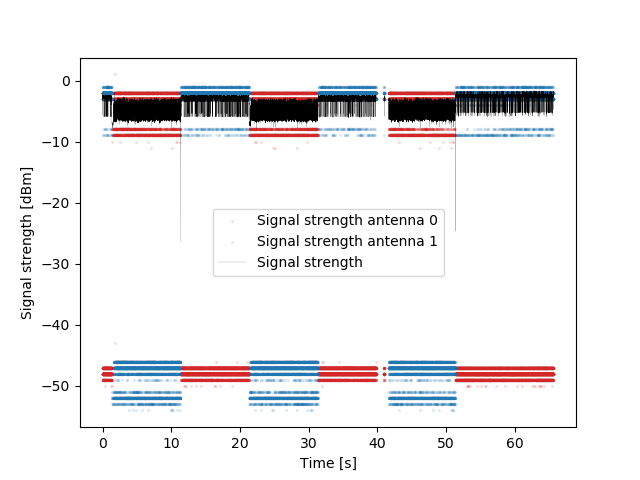
For most figures, places with more intense red and blue colour are values, which
were encountered more often. The black line represents the overall signal strength
provided by tcpdump.