Hello everyone, I’m Pierre, I was first introduced to Freifunk when searching for free WiFi in a cafe in Berlin, and I’m inspired by the radical visions of people attaching antennas to apartment buildings. Now I’m here to work on the community data API.
Since 2014, Freifunk has been collecting a snapshot of information about all communities, every hour, in a big directory available here. At the moment the data is being used for a calendar, a news feed,1 and a map of communities, among other services. Maybe you can think of lots of other things which could be done with that data, but first you would have to parse some 80,000+ compressed JSON files.
The goal of this Summer of Code project is to overcome that hurdle up front; make this community data more easily accessible, and uncover some insights about the network along the way. This is a typical situation for large archives, where one of the key challenges is making data readable and useful.
I intend to build a pipeline from the JSON directory through to some visualisations on a web page. One step behind that, I want to expose a GraphQL interface so that anyone else can query the data for their own purposes. The main part of this project revolves around setting up infrastructure to handle each section of this pipeline.
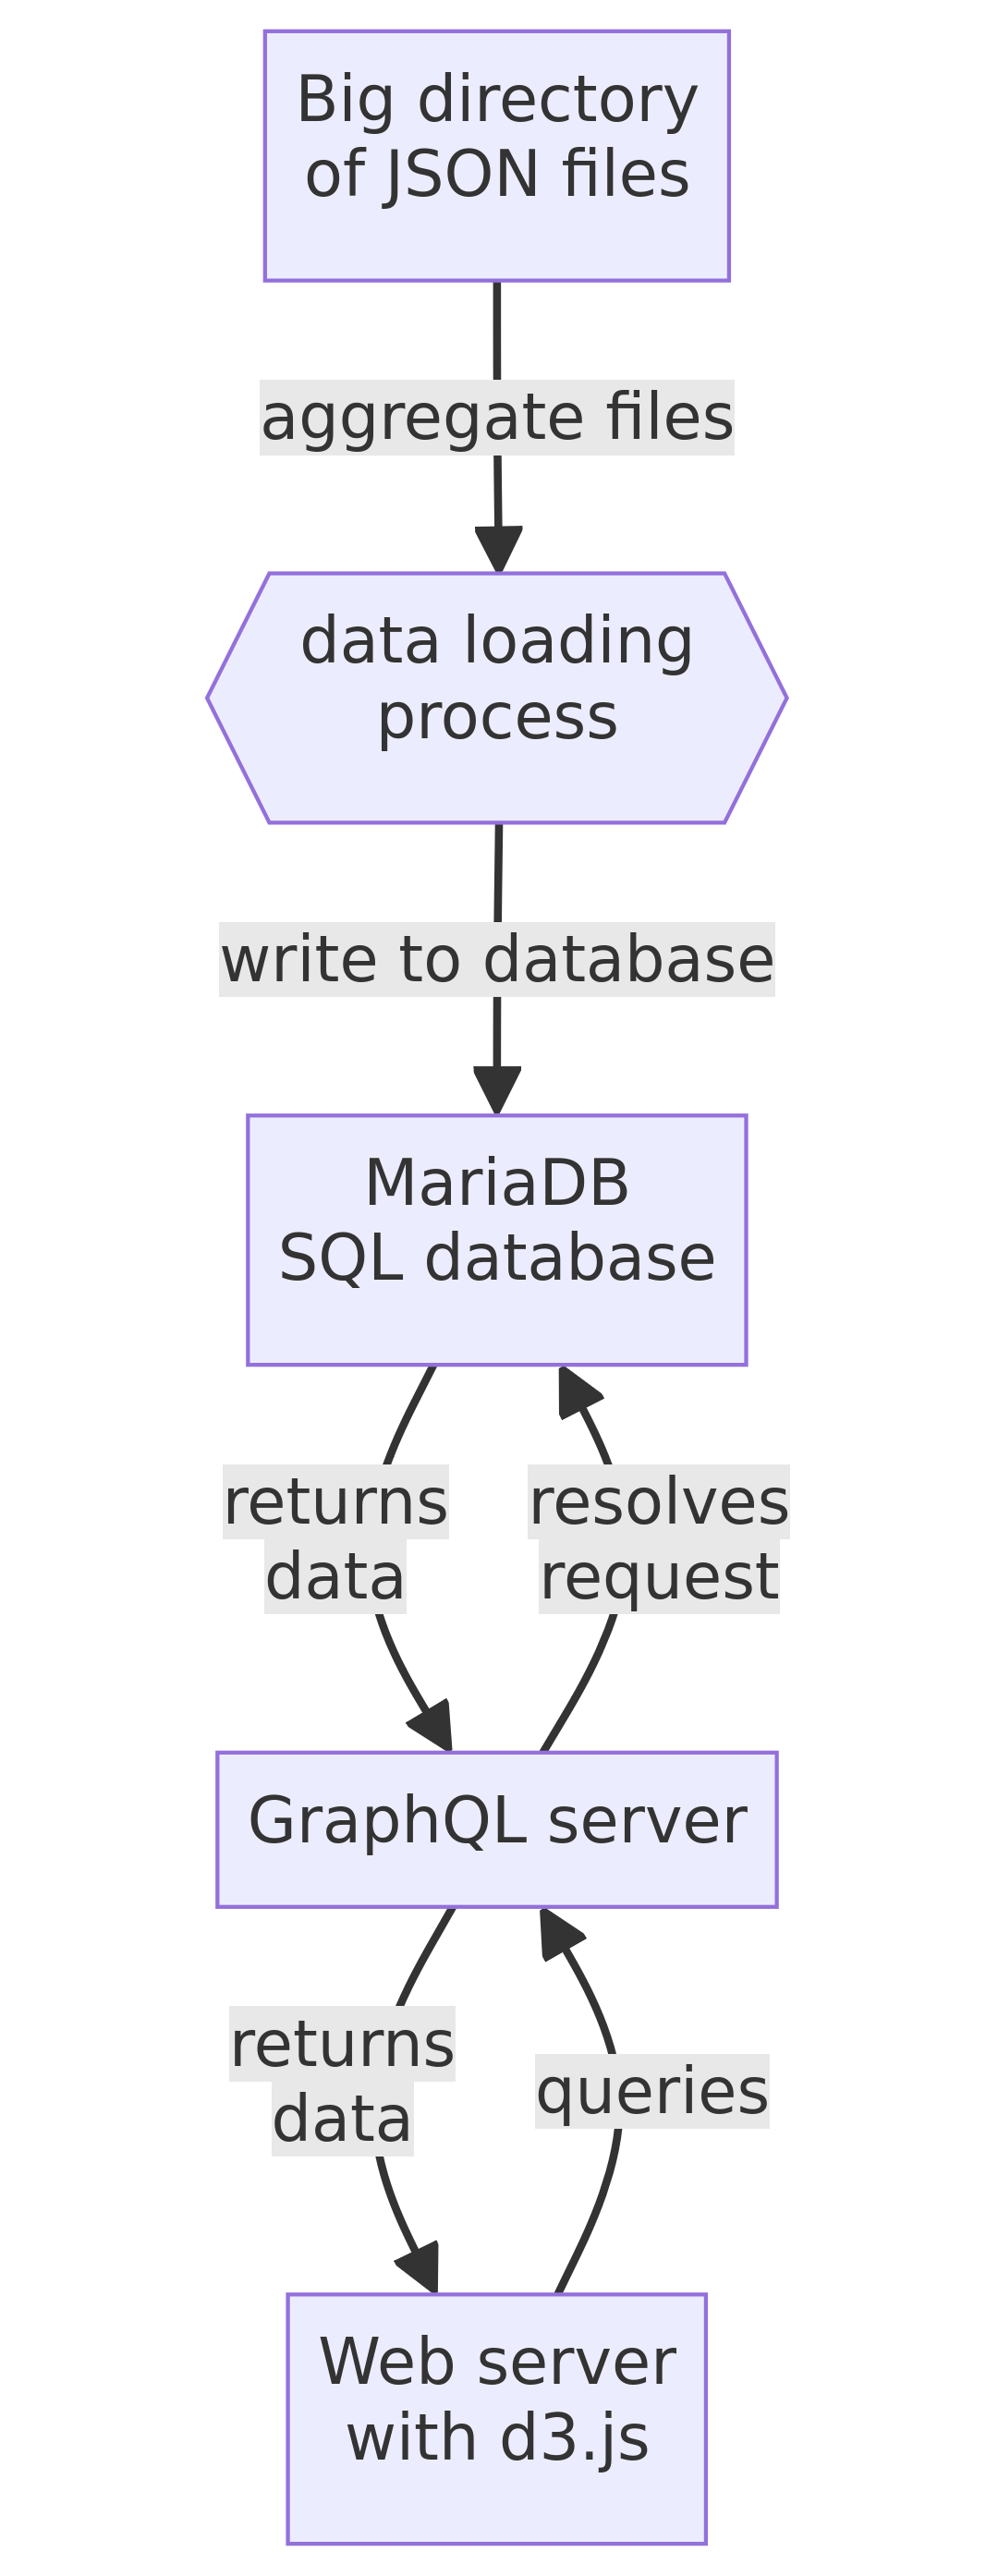
Although this system is conceptually very simple, there are lots of moving parts involved. The JSON files are loaded into a SQL database, the database talks to GraphQL, which itself talks to some browser-based visualisation library.
I’ve tried to make choices which prioritise boring technologies, reduce the fragility of this process, and hopefully make it easy to maintain in future. I will build it from the top down; starting with the database, and finishing with the visualisations themselves.
I’ll be working in this repository. There’s not much to show at the moment, but it should rapidly take shape in the coming weeks. My next post will be about the process of loading these files into a database.
- On which this blog appears, hello! 👋 ↩︎
2 thoughts on “GSoC 2024: Visualise community data”