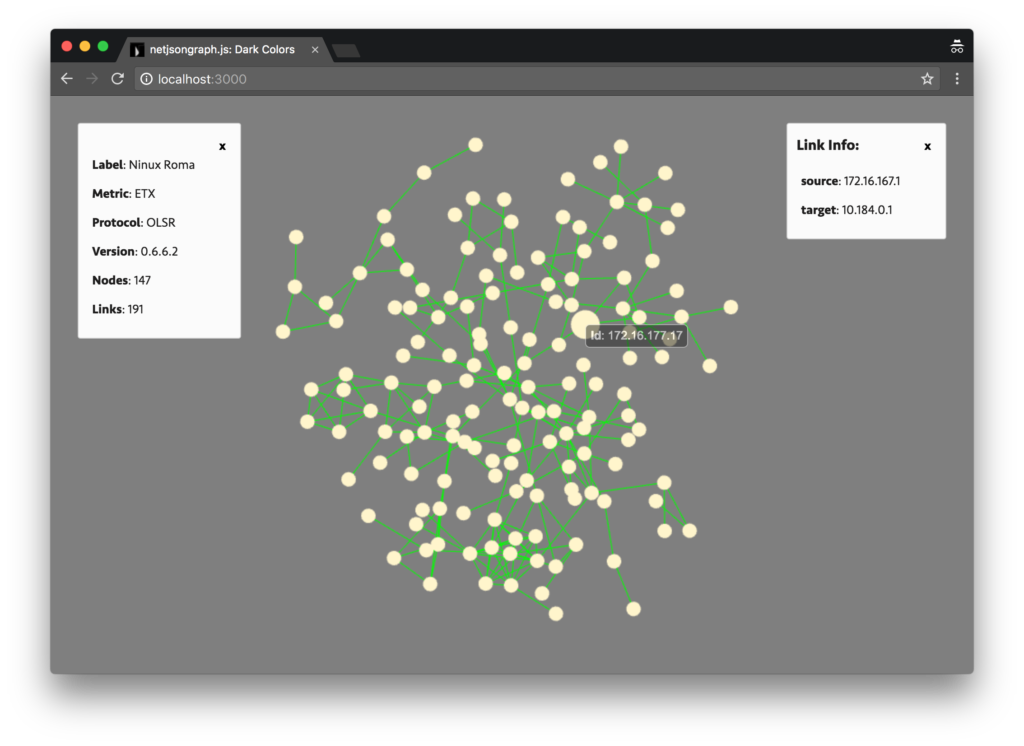
After a month of efforts, netjsongraph.js has been greatly improved.
First, I added some API and options are compatible with previous versions, except those that can not be added to the WebGL element. Followed by updating the documentation and some examples so that users can better understand and try out our projects. Finally, I have optimized interaction and performance.

Interaction
- added highlight effect on nodes and links when hovered.
- added tooltips with node information
- added pan and zoom interaction
- added node and link information panel when clicked
- adjust the size of the canvas when the window resized
Performance
The large part of the performance of force-directed layout is consumed in each element position calculation in every tick. So if the position calculation of the elements is before canvas rendering, it is effective to reduce the performance loss.
So I made a static layout https://github.com/netjson/netjsongraph.js/issues/44, there is no animation when rendering, directly render a static force-directed layout in the page.
Other
Besides, I have refactored the event controller, in order to make zoom and pan or other events added easily.
But now the overall rendering results are not good as our expected. There is a little lag in animation, I currently have no idea about the reason, perhaps because this is not best practice of three.js. In the next stage, I will focus on solving performance problems and improving the visual effect.
Next Plan
- improve performance https://github.com/netjson/netjsongraph.js/issues/41
- make animation and interaction smooth
- more tests
- add optional geographic map https://github.com/netjson/netjsongraph.js/issues/40
- fix more issues
The links below may be useful:
- http://taligarsiel.com/Projects/howbrowserswork1.htm
- http://igoro.com/archive/what-really-happens-when-you-navigate-to-a-url/
- https://github.com/alex/what-happens-when
- https://developer.mozilla.org/en-US/docs/Web/API/window/requestAnimationFrame