A lot has happened since I last updated you. Most importantly a working prototype of my IP space map has been implemented into nodewatcher!
While the first few weeks have been very slow (I was very lost in django), the last few days have been very fruitful. I have created a feature brench into which i have commited a few things. I started by creating my django module, creating a template, and adding needed css and js files. The files are heavely based on my prototype I built.
The features my IP space module for nodewatcher currently supports are as follows:
- Automaticly finding top level nodes
- Drawing nodes to a svg
- Zooming to specific topnode
- Tooltips for each node conteining its description and cidr
In the following weeks I have a lot of polishing to do. For example currently the svg has a resposnive size which disturbs the positioning of nodes as it is a wierd value. I also want to add another tab along side the map which will contain statistics (overal IP space usage and such).
Here are a few screenshots so you get a better idea of how the whole thing works (currently i am using nodes.wlan-si.net for nodes data as they have a few thousand nodes which is good for stress testing).
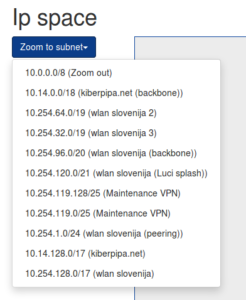
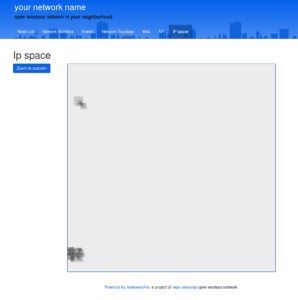
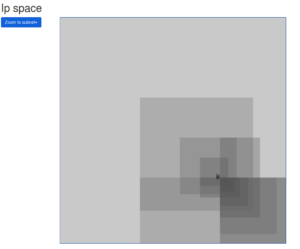
As u can see there is a list of top level nodes, a map of all nodes and a zoomed view to a toplevel node.