1 Intro
Like any network, in community networks it is important to know the status of each of the teams that compose it, to track these over time and identify possible problems.
To monitor the routers of the network we need to store the data of all the equipment, centralize, analyze and visualize it. The metrics that we reveal can be divided into two large groups:
- Numbers such as uptime, sent packets, signal strength, etc.
- Those that are text like the logs.
In this first stage we are going to concentrate on those of the first type.
2 Collecting the metrics
Prometheus is one of the most used free software for event and alert monitoring. The clients (the routers in this case) expose a http server which Prometheus scrapes with a periodic frequency (HTTP pull model) and saves the data in a time database. Prometheus defines 4 types of metrics that are used to generate each instrument (what we are going to measure).
Grafana allows us to connect with Prometheus and generate different personalized dashboards and extend the existing graphics to our needs. It also allows us to generate a system of alerts.
2.1 The setup for the first metrics
In our experimental setup we will create a mesh network with a router that has LibreMesh. In addition we will have a raspberryPi in the network where we will have installed Promemtheus and Grafana.
2.2 Prometheus client
As mentioned previously, each router will be running a Prometheus client which will serve via http a plain text with the client’s metrics.
2.2.1 Python vs Lua
Prometheus offers a library in python to do the implementation of the client. The problem is that when we are working on routers, the space available to install applications is very limited. The interpreter of python weighs 50MB but the interpreter of Lua only 4kB
2.2.2 A new client
OpenWRT has a client implementation of Prometheus on Lua, but we found two “problems” in this implementation :
- Use lua-socket to create the server which need install an external package. We are going to use uhttpd which is a server already installed on the router and allow us to execute a Lua script in a custom url.
- Each instrument is written from scratch. We want to implement 4 basic objects (the possible metrics) so that it is simple to extend to new instruments.
2.2.3 Initial Metrics
Initially we will measure:
- Uptime
- Load avg
- Mem info
- Package per interface
- iwinfo
- Chanel occupation
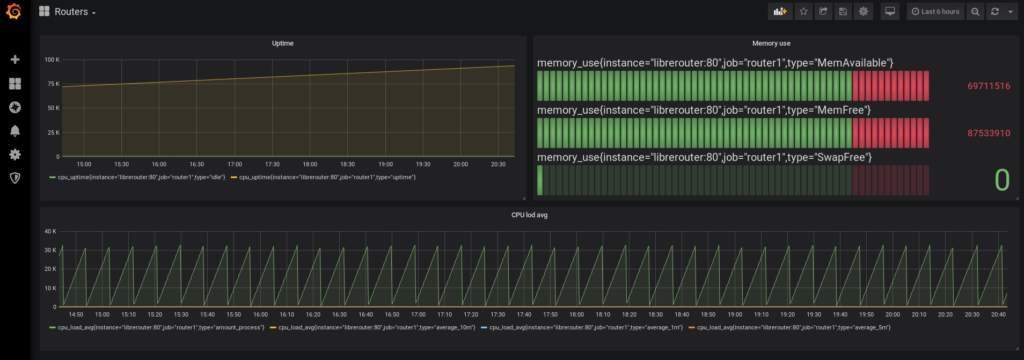
3 The first results
Some metrics collected by Prometheus visualized in a Grafana dash
Next steps
In the next week we will be working on:
- Add missing instruments
- Pack the client correctly
- Testing in a real mesh network
- Document these steps