The first phase of my GSoC journey focused on get packets level statistics. The works I have done can be described as follow, (1)building the openWrt testbed to run XDP code, (2)following the issues and threads in openWrt forum and community to get familiar with the barriers of running eBPF code on openWrt, (3)leveraging XDP kernel code in official XDP-projects to collect data of wireless traffic(4) implementing my own XDP kernel code and user space loader to collect statistics like throughputs and etc. (5) designing two scenarios, co-channel interference and channel fading, to validate the variation of packets level statistics. The following sections describe my explorations in details.(All the tests are performed on Thinkpad X201i with x86_64 openWrt OS)
XDP Capacity
Like many eBPF developers on openWrt, I encountered lots of barriers when setup a user space loader. It includes big and little endian problems, XDP and eBPF library chaos, architecture related issues and etc. All the problems shown are responsible to our implementation of eBPF/XDP traffic monitoring tool, because we cannot bypass the official XDP support.
Previously, we just have one native XDP loader on openWrt – iproute2. It is indeed a method to load XDP object file, while it would do nothing about user space code, which provide the most convenient method to manipulate different statistics.
When crossing compile the XDP kernel program to BPF object file, the implicit include path of lib headers brings lots of chaos.
Getting the data collected by kernel code
Since we just had official xdp-tools support on openWrt recently. There are two ways for packets-level information collection.
- collecting data from
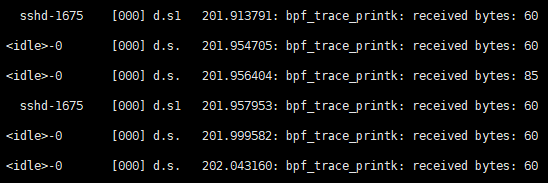
/sys/kernel/debug/tracing/trace. Debugging level print is a way to retrieve data collected by kernel programs. Specifically, usingbpf_trace_printkhelper function. However, it is a little different for XDP kernel program to output information todebugfs. The main reason is that XDP kernel objects are driven by XDP events, that is packets ingress, we are only able to callbpf_trace_printkwhen the packets come in, which limits the flexibility of statistics poll. So, collecting data fromdebugfscan be seen a trade-off between official xdp-tools support and collection capacity.
The procedure of this way can be described as follow:
- crossing compile the XDP kernel program to object file using openWrt SDK or even using host clang
- uploading the object file to openWrt router and loading it using iproute2 or
xdp-loaderin xdp-tools package - getting data from
debugfsand do post-processing
- collecting data via user space
xdp-loader. Another way to collect XDP kernel data, which is also demonstrated by xdp-project, is to implement user space loader to load the kernel program and get statistics simultaneously. My method is to leverage xdp-tools‘ APIs such asattach_xdp_programprovided in util to implement user spacexdp-loader. The reason is xdp-tools is not stable ,while portingxdp_load_and_stats.cto openWrt is equivalent to manipulating xdp-tools package which have been done by others. However, I just followed the PR xdp-tools: include staging_dir bpf-headers to fix compiling with sdk by PolynomialDivision · Pull Request #10223 · openwrt/openwrt (github.com) to get myxdp-loaderwork on x86_64. In user space, packets level data collection related struct is
 struct record {
       __u64 rx_bytes;
       __u64 rx_packets;
       __u64 pps;  //packets per second
   }
The user space loader is like
   static bool load_xdp_stats_program(...) {
       ...
       if (do_load) {
           err = attach_xdp_program(prog, &opt->iface, opt->mode, pin_root_path);
       }
       ...
       if (do_unload) {
           err = detach_xdp_program(prog, &opt->iface, mode, pin_root_path);
       }
       ...
       stats_poll();
   }
As mentioned above, we have tried two ways to build up an entire system running XDP code to collect packets level information. Method (1) is more of a hacky approach while method (2) is still in progress.
Dedicated use cases
Due to the rate adaption mechanism in mac80211 subsystem, there are many situations that will affect the wireless transmission link, thereby affecting the throughput of the wireless network cards, which is reflected in the number of packets and bytes received and sent. We designed two scenarios, co-channel interference and channel fading, both related to packets level statistics, which could be our future classification samples.
For co-channel interference scenarios, we have two routers corresponding to two laptops. In the scenario without co-channel interference, router A is set to channel 1, the laptop C and router A form a wireless link using iperf3. At this point, the router B and laptop D are powered off. In the scenario with co-channel interference, the router B is set to channel 3, which brings spectral-overlap.
For channel fading scenarios, we use a pair of receiver and transmitter, then change the distance between them to validate variation of throughput, and also put some occluders on the line of sight to change the transmission state of the wireless link.
Conclusion
It has to be said that running eBPF code on openWrt is really a unique experience, and I also saw the efforts to official eBPF support in openWrt community. It is a tough journey to try different user space loader and build up a monitoring environment. Since I spent lots of time setting up my first eBPF environment and running the entire XDP program on my openWrt PC. The schedule for the next phase will be tight.
Next phase of GSoC is clear:
- There are some other information that xdp hook not supported like signal strength , SNR and etc. I will explore eBPF capacity to get such data
- We still have no bug free XDP support on openWrt so far. I will participate in community to do related work
Thanks for reading!