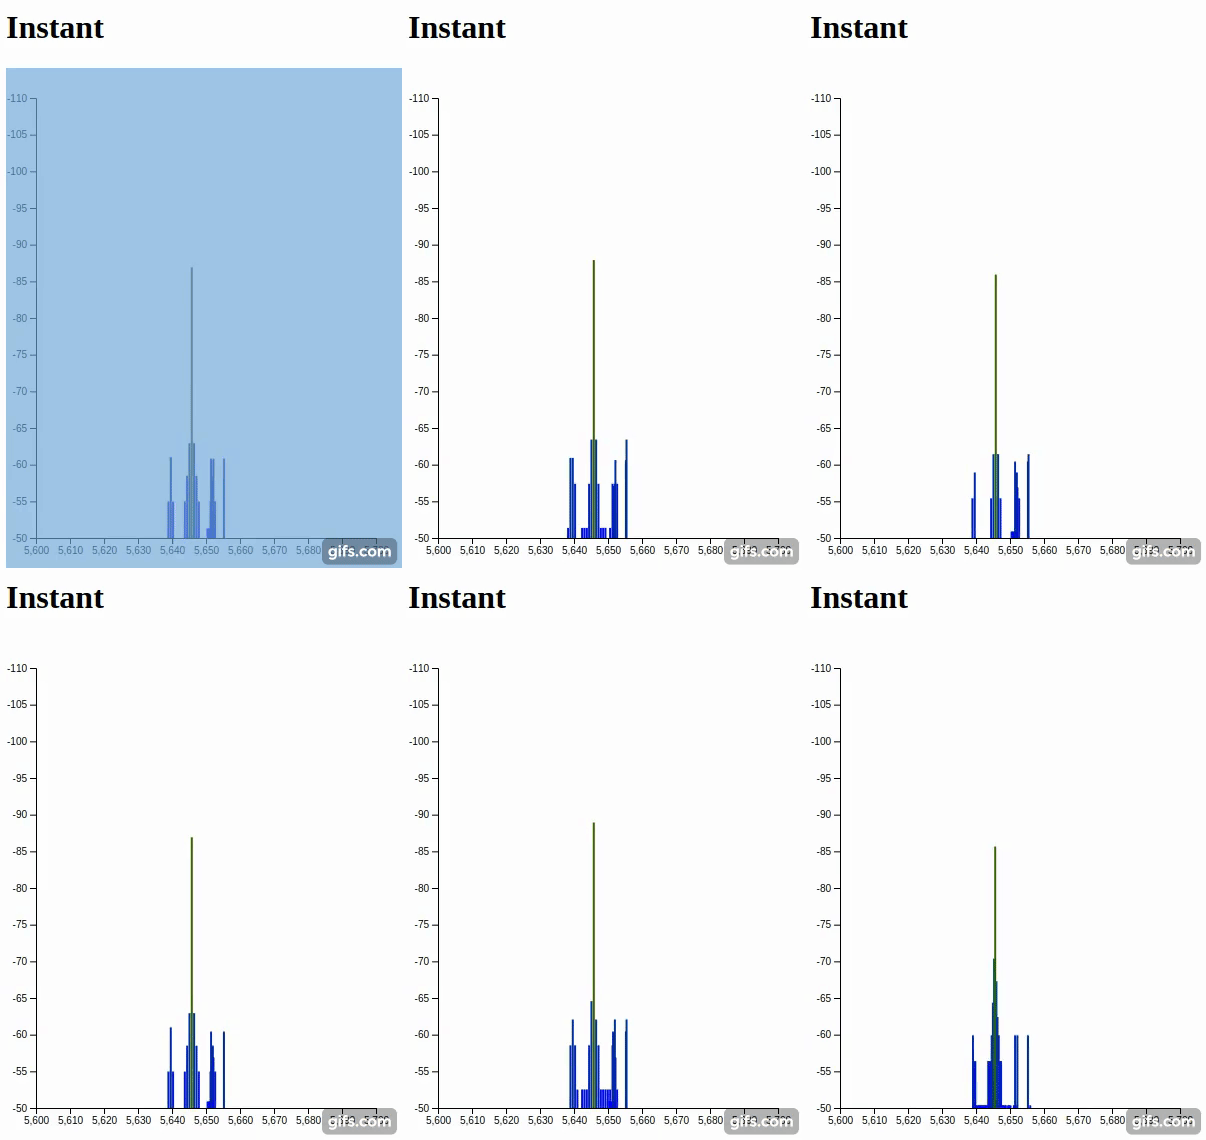
This is the second update of the spectrum analyzer project.
I’m glad to say that we have a visualization that is allowing us to view the output of the card in a meaningful way.
After polishing this interface I will create the waterfall and the cumulative views that are useful for this.
I will leave you a screenshot of how it looks right now (it will get better soon).

Also, we have started conversations with a University that has done an MVP of a PAWS database. The purpose of this is to gather information on the spectrum usage in the TVWS frequency.
With the help of the TVWS Frequency Shifter that Elektra is developing, we will be able of doing site surveys on those frequencies.
This will allow any OpenWRT device with an ath9k radio and a frequency shifter and a GPS to act as a surveyor of those frequencies.
Also had the chance to support the LibreMesh project by adding a Continuous Integration server that will be soon merged to the master branch. That will allow the project to keep on safely by having tests that ensure that the code does what it says it does.